
 Continuing the series of analyzing the NFL draft by position from last year, this post will look at defensive backs. How likely do the top picks outperform the later ones? How often do later picks turn out to be solid contributors? How do they compare to other positions? Using data from all defensive backs taken from 1980 through 2001 I'll answer those questions.
Unfortunately, the draft data at Pro-Football-Reference.com does not distinguish between cornerbacks and safeties (for understandable reasons). They are all considered defensive backs, so this analysis will have to do the same.
First, let's look at Pro Bowl selections. As I've mentioned before, Pro Bowl selection is a very limited measure of a player's value. In fact, no single measure can be perfect. But Pro Bowl selection does tend to signify the top players at their positions, and that's really what much of the draft about.
The graph below illustrates the likelihood of a defensive back taken in each round to be named to 1 or more, 2 or more, and 3 or more Pro Bowls in his career. As you'd expect, there is a steep drop off after the first round.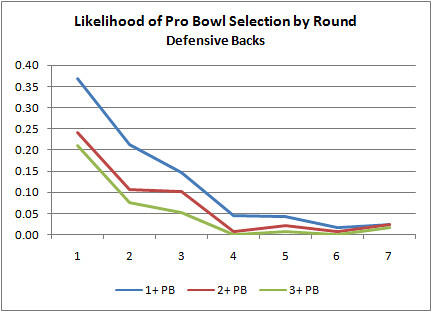
The next graph illustrates the same thing, but by draft order--in other words, regardless of round or overall pick number, was the player the 1st, 2nd, 3rd and so on defensive back taken? After the top couple DBs taken each year, there's a steep drop off in the chances the player will turn out to be a star.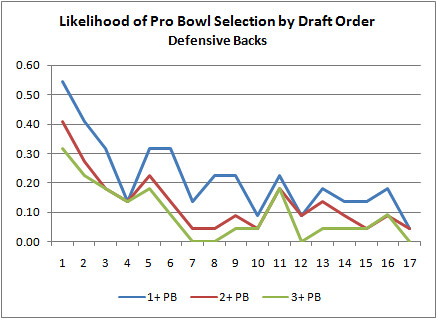
Notice anything about the shape of the distributions? They're power law probability distributions, the signatures of many natural complex systems with all the implications that come with them. The next graph isolates just the '2 or more' Pro Bowls likelihoods and fits a power law curve.
Next is a graph of years as a starter by draft position. No, this time it's not a power law distribution but an exponential one, which is a little easier to interpret. Every subsequent DB taken will have an average career as a starter 7.9% shorter than the earlier DB taken. There may not be many stars in the later picks, but there are plenty of durable starter-quality players to be had.
Although it's not the only measure of a DB by a long shot, we still want them to intercept passes as often as possible. The next graph looks at the total number of interceptions by draft order. Just like the years as starter graph, the curve is exponential with an average 7.4% difference in total interceptions from any given DB pick to the subsequent pick. I'm not sure this tells us anything more than the last graph of years as starter. The two graphs closely mimic each other for obvious reasons.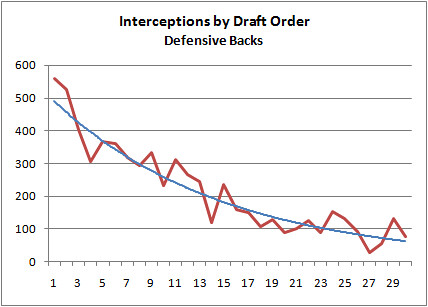
The last graph we'll look at is the likelihood the a DB draft pick will turn out better than the subsequent DB chosen. To define 'better' I used years as a starter rather than any of the other measures. All the measures are flawed, but I think years as a primary starter is the safest measure because it captures so much other information, both quantitative and qualitative, about a player's performance.
This graph will tell us how well scouts and personnel executives identify the better prospects. But looking at DBs in isolation doesn't tell us much, so I added RBs and QBs to the graph for comparison.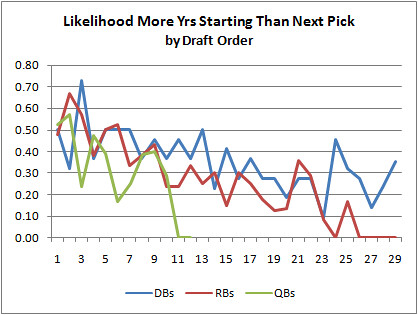
All three positions are fairly noisy, but it looks like scouts can identify the superior DBs slightly better than RBs and QBs, particularly deeper in the draft. What this means is that GMs can have slightly better confidence when picking a DB than the other selected positions. We should expect an inverse relationship between the ability of scouts to identify the superior prospects and how deep into the draft teams can expect to find solid starter-quality players.
And that's really the point of all this analysis. In order to eventually build a sound comprehensive model of draft strategy, we'd need to know all of the likelihoods of success for the various positions in each round and at each pick order. In the meantime, it's useful to know how deep into the draft a team can find viable contributors at the various positions.
Drafting Defensive Backs
published on 4/16/2009


Subscribe to:
Post Comments (Atom)
For a comprehensive model of draft strategy, is it worth considering the duration of a player's contribution?
That is, if we expect certain positions to generally lead to longer careers than others, would it be a better idea to invest in players that you can keep around for 10-12 years rather than 5-7? Or does free agency and the salary cap render such analysis useless?
I say this because I've never been a fan of drafting RBs or CBs early, particularly RBs. They seem injury-prone and just don't seem to last as long as, say, OL or QB or even DL. Plus, RBs seem to be more easily replaced than other positions, and DBs' contributions seem to be smaller than other positions- Asomugha can only help the Raiders so much.
Agreed. That's one reason I think 'yrs as starter' is a reliable measure for comparing players at different positions.
On the other hand, teams are mostly selecting players only for the duration of their rookie contract.