
 The is the third part of a four-part article on 4th down decisions. In the first part, I reviewed the concept of Expected Points and the concept of expected utility. The second part detailed the kicking game and its expected values. This, the third part explores the value of 4th down conversion attempts. The final part of the article will put all the concepts together. Ultimately, I'll conclude with a chart of recommended decisions for 4th downs at every combination of field position and distance to go.
Going For It
 The value of a successful conversion attempt would be at least the EP value at the 1st down marker. Often, conversion attempts would obviously go further than the marker, but for now let's consider the minimum value of the conversion. The minimum value of an unsuccessful conversion attempt would be the EP value of a 1st down for the opponent at the spot of the attempt.
The probability of a successful conversion is primarily dependent on the distance to go. Field position also affects the chances of success due to the compression of the field in the red zone. With less area to defend, the defense's task is easier. The graph below plots the probability of a successful conversion by distance to go, broken out by areas of the field.
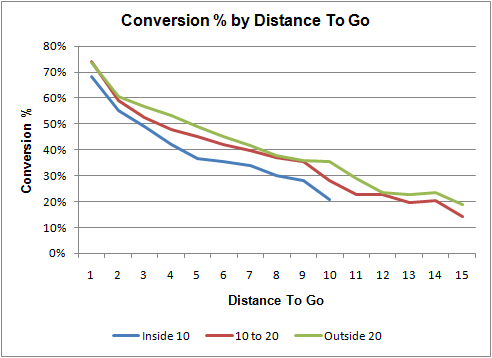
For example, a 4th down and 3 at the 50 yd line could be converted 56% of the time. A successful conversion would (at worst) give the offense a 1st down at the opponent's 47, worth 1.9 EP. And an unsuccessful conversion would give the opponent a first down at the 50, worth 1.8 EP to them and -1.8 EP to the current offense. The value of going for it is therefore:
A Sample Situation
Let's start with a punt. From the 37, we would expect a net punt distance of 23 yards, coming to the 14 yd line on average. The 14 yd line corresponds to -0.2 EP for the opponent, which is +0.2 EP for your team.
A FG attempt would be successful 45% of the time. A made FG would yield 2.3 EP factoring in the kickoff. A missed FG would give the ball to the opponent at his own 44. This is worth 1.1 EP to him and therefore -1.1 EP to us. The total expected point value of a field goal attempt would be:
Continue reading the 4th and final part of this article.


thanks for the great articles! in the example under the chart should the equation not be:
(0.56 * 1.8) + ((1-0.56) * -1.9) = 0.17 EP?
4th and 3 from the 37 yard line, scores tied, early in the 2nd quarter - coaches have punted 100% of the time? That is shocking - although with that information a coach could well suppose this situation is perfect candidate for a fake punt.
Given the rarity of fake punt data I imagine you wouldn't be able to calculate a utility for the fake, but if receiving teams are expecting a punt 100% of the time then there's a good chance the fake would gain more than 3 yards on average.
Minor quibble, your last equation is missing a "(".
I'm really enjoying these articles and will be passing them around to a few friends when the last one is up.
Also, if you want to really get the point across, the EP to go for it is at least 1.3, since, as you say, you can always get a few more yards than what you need.
Edge-Love your sound. 'Elevation' is my favorite. Thanks for the catch. The equation was right. It was the text above it that switched the 1.8 and 1.9. Fixed now.
Two minor questions: Your win probability function says a 1st and 10 on your opponent's 34 is worth 3.0 EP, but you have 3.3 in your equation. Also, does your EP model factor in the 0.7 from potential ensuing kickoffs automatically?
A more intriguing question: If a coach were to adopt this strategy, how much would that affect you EP model? Because it is based upon the past results of conservative coaches kicking and punting frequently, a coach that went for it on 4th down more often is less likely to kick a field goal, particularly as he gets closer to the end zone as 1st downs have increasingly higher EPs. Wouldn't this result in a different EP? Whether it's higher or lower I can't say, but it seems unlikely it would be the same.
Furthermore going for it on 4th down more often has a greater variable result in that a coach is less likely to attempt field goals and more likely to have TD or nothing drives. In some situations there is going to be an equal EP for field goal attempts and 4th down conversions, but the field goals will be much more consistent.
For example, it's 4th down on the 10. At this distance, field goals are made ~95% of the time, resulting in 3 * 0.95 = 2.85 EP. Say there's a 41% chance of scoring a touchdown, that also results in 7 * 0.41 = 2.85 EP. However, I would think most people would go for field goals in this situation because they are more reliable at 95% than touchdowns at only 41%.
If this situation came up only twice in a game, 1/3 of the time you would end up with 0 points (1 - 0.41)^2 = 0.34 by going for it versus (1 - 0.95)^2 = 0.0025 or <1% of the time with an FGA.
If you're looking for the minimum cost, shouldn't you consider an attempt that falls just short, like getting 2+ yards on 4th and 3? Calculating the cost of not moving the ball is probably reasonable on passing downs, but even then some percentage of the time the offense will complete a pass short of the first down and turn it over but suffer less than they would if it hadn't been completed at all.
Alex-Good point. I'm assuming the 'reasonable worst case scenario' for a failed conversion attempt, which is a gain of zero yds. That way, the final recommendations will be on the conservative side and ultimately more convincing.
where does your conversion data come from?
ie, "a team will convert 4th and 3 56% of the time from the 50 yard line"
That's the league average from 2000-2008. Because 4th down conversion situations are relatively rare, I also used 3rd down conversion rates to "support" gaps in the data. The graph above shows the raw, un-smoothed conversion rates.
James,
Your numbers are off a little bit. You can't just say a FG = 3 * 95% because that doesn't account for the fact that you are giving up 0.7 EP on the ensuing kickoff. The same obviously applies to the TD. By the same token, a failed kick or TD will result in your opponent being pinned deep with a negative EP (and you having a positive EP by extension).
The real equation is:
FG = (2.3 * .95) + (-0.1 * .05)
TD = (6.3 * .41) + (0.4 * .59)
2.3 = 3 - 0.7 (opp EP after kickoff)
-0.1 = -1 * opp EP after getting ball on 17
0.4 = -1 * opp EP after getting ball on 10
Not accounting for the significant difference in field position after failure is the main reason why coaches screw up this equation. Its weird because when they have to choose between punting from the 37 and going for it, they are very aware of the importance of field position, but when they have to decide about going for it inside the 10, they seem to act as if giving them the ball on a kickoff and giving them it on the 5 yard line are the same.
I think failing to account for the significant
Jeff,
I was just trying to make a simple example and left out the kickoff factor on purpose to simplify the calculations. I was trying to emphasize my main point: at what point does consistency outweigh the extreme expected points variability of a given situation?
That raises an interesting point. A lot of people have trouble accepting the 'kickoff factor.' It's kind of an abstract concept. People who tend to think concretely say, 'No, a FG is 3 points!'
But the kickoff factor really only makes a difference at the margins. If you leave it out of the analysis, the resulting recommendations are largely unchanged.
James,
Obviously, what you really want to be maximizing is Win Prob and there are a number of situations where a nearly guaranteed 3 increases WP more than a shot at 7. However, we know that coaches are kicking even when it doesn't make sense on a WP basis. I tend to think that consistency is overrated.
A mutual fund manager should be consistent. An 8% gain a year is better than a 150% gain one year and a 100% loss the next. A coach can't walk out of the stadium with a 60% WP. Its going to 100 or its going to 0. Accept that and make the decision that maximizes your probability of ultimate success.
Yes you are gambling that you will get the 7, but if you don't do it, you're also taking a gamble that 3 points will ultimately be useful.
Brian,
I actually think the kickoff factor is extremely important to the calculations. You're right that it doesn't change the overall conclusions most of the time. When you don't include it, you tend to get: "You should probably go, but its a really close call". When you include it, you get: "You really should go and you're making a large mistake by not going".
Frankly, not to insult anyone, but if you think so concretely that you can't understand the math on the kickoff factor, owners shouldn't be paying you millions of dollars to make these decisions.
Re: the conversion %
Are you only using 3rd down conversion %'s or 1st-3rd down %'s.
Do conversions by defensive penalties get factored in?
Conversions made on 1st and 2nd downs are not considered.
Yes, conversions by penalties are factored.
If the conclusion of your argument is correct (coaches are generally over-cautious on 4th down conversions), wouldn't that mean that the conversion % number from 2000-2008 would be inflated? If coaches are generally cautious, wouldn't you expect the 4th down conversions they DO attempt to be in situations where they feel they are more likely to succeed (weak defense, etc), and therefore have a higher conversion rate?
I'm not sure it's accurate to then use those conversion % numbers as a general average.
Yes, that's the purpose of using 3rd down conversion data.
Very interesting analysis. One missing element from what I can tell here is the actual field position for the defense on a missed conversion. Your model assumes the original line of scrimmage. In reality, cahnge of possession can occur in many ways. Sack (meaning a gain for the defense), interception returned for TD, interception or fumble recovery in end-zone (touchback at 20 yard-line), a partial gain that does not reach the first down marker or a turnover past the first down marker. I believe your model undervalues the defenses field position after an attempt. You should be able to determine the average field position from the eight years of data. Likewise, as you state, you are underestimating the field position of the offense given a successful conversion. To fully appreciate the value of the various scenarios this additional detail should be considered. Bill Mallett
I apologize if this has been said and I missed it, but I believe you are being too simple in your assesment of a missed fourth down attempt. Gaining 0 yards is not the worst thing that can happen on a failed fourth down attempt. A pass can be intercepted or a fumble can be returned and give the other team even better field position, not to mention if a runner gets hit in the backfield and loses yardage. For the sake of accuracy you need to look at percentage of fourth down plays being passes vs. runs, then fumble and interception rates on these type of plays, and then also look at average yardage gained/lost on failed attempts to give a true field position that results from a failed fourth down attempt. This may be insignificant in many cases but can likely tip the balance in the hard decision category where people say coaches are too conservative. This may show that coaching experience is more accurate to the actual numbers than what people think.
You make a conclusion that the average kickoff return is to the 27, so you use the 27 yard line as your Expected Point value of a kickoff. However, I would think there is enough data to determine the Expected Point Your assumption that the opposing team will get the ball on their own 27 yard line, completely eliminates the possibility of a fumble on the ensuing kickoff.
I would be interested to see if you did the same study for emergency situations. What is the Expected Point value of an unexpected onside kick, and even the expected onside kick. WOuld that make a difference in kicking a field goal vs. going for it on 4th down if your EP changes based on the Onside kick that would come immediately afterward.
Sorry, I got caught up while typing the last comment.
I meant to say
"You make a conclusion that the average kickoff return is to the 27, so you use the 27 yard line as your Expected Point value of a kickoff. However, I would think there is enough data to determine the Expected Point of the kickoff itself. Your assumption that the opposing team will get the ball on their own 27 yard line completely eliminates the possibility of a fumble/recovery on the ensuing kickoff."
How did you determine those conversion %s? Or are we supposed to blindly accept your numbers as fact?
To Anonymous jerk in previous comment. Read the report. Read the previous comments on this page. The author clearly says where the conversion numbers are pulled. I have quoted them below. It is fine if you are too ignorant or lazy to read and comprehend what the author is describing (thus your question,) but your disparaging followup sentence based off of this ignorance is just deplorable.
"That's the league average from 2000-2008. Because 4th down conversion situations are relatively rare, I also used 3rd down conversion rates to "support" gaps in the data. The graph above shows the raw, un-smoothed conversion rates."
Suppose the average return on a kickoff is to the 27 yard line, ignoring fumbles for simplicity. The expected points wouldn't be the expected points from the 27, though. It would be more accurate to sum the probability of the return to each yard line times the expected points at that yard line, over all the yard lines. Ie, the probability of a return to the 1 times the expected points at the 1, plus a return to the 2 ...
Whether it's worth the trouble depends on your data, I guess.
I downloaded the 2002-2008 data and am trying to reproduce your numbers. I got roughly the same results for net punting distance and FG %, but I'm not getting the same thing for 1st down conversion rates (on 3rd or 4th down). Here are the rules I'm using...
It's a 3rd or 4th down attempt if...
down = 3 or 4 and
it's not a punt (description has "punts" in it) and
it's not a FG attempt (description has "field goal" in it)
It's a 1st down conversion if...
it's a 3rd or 4th down attempt and either
description has 'touchdown' in it or
the next row has down = 1 and the off value remains the same and the quarter did not change from 2 to 3
So my conversion rate is the number of conversions divided by number of attempts for a given togo value (and within a given chunk of ydline values). Example of a specific number that doesn't match the chart above:
1st down conversions where ydline < 11 ydline and togo = 1...
766 conversions / 1279 attempts = .599
but on the chart it looks like the conversion rate is about 68-69%
When I restrict to just the 1st and 3rd quarters my numbers change to 327 / 521 = .628
Any idea what I'm missing?
Thanks,
Rob L
I think this stuff is worth understanding and knowing, but as a coach, i do not think you should follow this to a t. Although an opponent may have a given edge if they have a first down oa given yardline, after a failed attempt, the momentum and emotional edge I believe could be statistically shown to be real. I believe after a big defining moment, the edge is bigger for opposing offense, they are pumped up, particularly with the crowd either taken out of it, or out into it. So I think the decision to punt is often best in marginal situations, and there is an edge to keeping the other coach guessing on what you are going to do. He shouldn't always be ready for you to go for it in any situation, you may cause him to use a time out, or have the wrong team on the field and it may provide you with a bigger edge when you need it. Also, what about going for it vs fake punt? Additionally, the given 4th down conversion percentages are higher when opponent doesn't know tendencies... The more you go for it, the more opponents know about what you do. Certainly coaches should be more aggressive, but not quite as much as Following a chart whenever there is any small edge "on paper" for some intangible reasons and some tangible reasons. I would sometimes go for it when chart says not to if it was marginal because being perceived as "unpredictable" causes opposing coaches to do some very stupid things and get off balance and take things personal. In poker it is showing a bluff to get opponent to go on tilt and get him to call your bluffs