
 Bill Parcells famously said "You are what your record says you are." Although that's undeniably true with regard to how the NFL selects playoff teams, and I wholeheartedly believe a leader needs to think that way, Parcells is only 58% correct. That's not a joke. It's 58%, and here's how something like that can be measured.
One staple of statistical analysis in sports is estimating how much of a given process is the result of skill and how much is the result of randomness or 'luck'. By luck, I’m not referring to leprechauns, fate, or anything superstitious. Real randomness is far more boring. Imagine flipping a perfectly fair coin 10 times. It would actually be uncommon for the coin to come out 5 heads and 5 tails. (In fact, it would only happen 24% of the time). But if you flipped the coin an infinite number of times, the rate of heads would be certain to approach 50%. The difference between what we actually observe over the short-run and what we would observe over an infinite number of trials is known as sample error. No matter how many times you actually flip the coin, it’s only a sample of the infinitely possible times the coin could be flipped.
As a prime example, the NFL's short 16-game regular season schedule produces a great deal of sample error. To figure out how much randomness is involved in any one season, we can calculate the variance in team winning percentage that we would expect from a random binomial process, like coin flips. Then we can calculate the variance from the team records we actually observe. The difference is the variance due to true team ability.
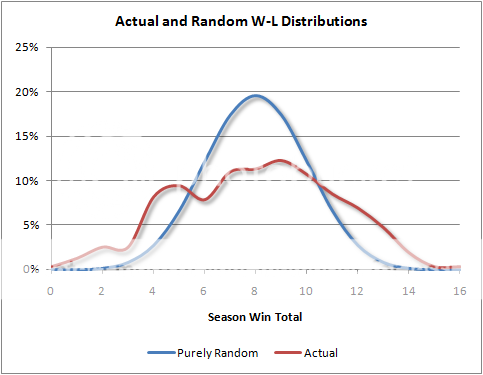
The wider the observed distribution is compared to a potentially purely random distribution, the more true ability matters. And variance is what measures the width of a distribution. Hypothetically, think of a 16-game round-robin football league where the better team always won, eliminating all sample error. There would be 1 team with 16 wins, 1 with 15 wins, and so on. This would be a very wide and flat distribution.
Let’s compare the actual variance of team winning percentage with the purely random variance. The observed variance from the ten most recent NFL seasons (which is the square of the standard deviation) is 0.194^2. The binomial variance over 16 trials (games) is always 0.125^2.
We can calculate that the ‘true’ variance of an NFL season is 0.148^2. Further, we can say that the proportion of luck in the outcomes we observe over a full season is :
...which is 0.125^2/0.194^2 = 42%.
Put simply, 42% of an NFL team’s regular season record can be accounted for by randomness, otherwise known as sample error. The short 16-game season is too small of a sample to provide much confidence that team records accurately reflect their ‘true’ level of ability. The more games in a season, the smaller the sample error, and the more certain we could be that the teams with the better records are truly the better teams. (Please note I am not advocating a longer season. The purpose of the NFL is not a scientific experiment to clinically determine the best team.)
Another way to look at the relationship between true ability and randomness is in terms of r-squared, which is the proportion of variance, and r, which is the correlation coefficient. The r-squared of randomness is 0.42, and the r-squared of true ability is 0.58. That makes the correlation coefficient (r) between observed team records and a team’s true ability the square root of 0.58, which is 0.75. This means that after a full season of 16 games, your best guess of a team's true team strength should regress its actual record one quarter of the way back to the league-wide mean of .500. (I found very similar results using a more clumsy method a few years ago.)
So although the answer may not be precisely 58%, the effect of sample error helps explain why we see apparently ‘bad’ teams like this season’s Buccaneers have winning records and apparently ‘good’ teams like the Chargers have losing records. It’s also why the NFL is notoriously hard to predict, and why regression to the mean is so strong from year to year. The more random the process, the stronger regression will be.
The framework of var(observed) = var(true) + var(random) applies to more than just season records. It applies to any process, whether in sports or in real life. In a subsequent article, this method will be the basis of an examination of what proportion of a QB’s interceptions can be attributed to sample error.


I can think of two other assumptions that will make randomness appear to be a larger factor than it likely is in reality.
One is home field advantage. Continuing with the assumption that team strength is transitive, if you listed out each team with some sort of relative handicap (like here for example), you'll see that for just about every team, there are several teams within a few points. Estimates of home field advantage are typically between 2.5 to 3 points. So assuming that home field advantage is roughly constant across time and stadiums, a team that is estimated to be 1 point better than its opponent would be at a disadvantage on the road. If the better team loses by a point or two on the road in this case, it would count as randomness, even though it could plausibly be explained by home field advantage.
The other assumption is that a team's ability stays constant over the course of a season. But our observational experience of injuries and mid-season collapses, suggest that this is not the case. Perhaps it was just random that the Broncos were successful early on, and struggled late in 2009, but the reality is that it's an adaptive league. Once weaknesses of a team are exposed, its opponents can exploit them in copycat fashion. Having information about how to beat the Broncos in late 2009 actually made the Broncos a worse team than they were in early 2009, without significant injuries or changes in game planning/coaching. Granted, it becomes difficult to recognize a mid-season collapse ahead of time, and sometimes even during it.
I think randomness plays a large role in deciding NFL winners, but less than is suggested here. Difficult to measure though.
I love the overall calculation that points to 42% of a team's W/L record being attributed to randomness. But I think it's important to point out that that this 42% is a blanket figure that applies to the league in aggregate. I would argue that only applies to each individual team to the extent that each team has played competition of similar skill. In other words, if a team stunk very, very bad (imagine a high school team being forced to play in the NFL) their record would be 0-16 and that would have almost nothing to do with randomness. The *point spread* in any given game might be more subject to randomness, but the fact that they lost every single game had everything to do with their overall lack of talent.
The degree to which randomness determines a specific game outcome should be a function of the relative talent/skill difference between the two teams. So if two teams are perfect mirror images of each other (regardless of whether they are *good* or *bad* teams) and they are playing in a neutral environment, the result of the matchup would be entirely predicated upon randomness. But if one team is extremely good and the other is extremely bad, the subsequent butt-kicking has very little to do with randomness or "luck".
A famously remember a simulation where 162 game baseball seasons were played out with 30 teams that had no statistical advantages (ie, each game should have a 50-50 outcome). You still had successful teams (95 wins) and losing teams.
Surprising.
Good point above. Accounting for the effect of home field advantage (HFA), the answer is 41% randomness, 59% ability.
In the NFL, HFA makes the home team a 0.57 favorite.
The variance of any binomial process is np(1-p). So the random variance of a 16 game season should be 16*0.57*(1-0.57) = 3.94.
The actual variance in win totals since 2000 is 9.60.
3.94/9.60 = 41%
Anon- The variance of wins in a binomial process with n=162 and HFA=.5 is: 162*.54*.46= 40.24 wins, so seeing a team win 95 games is definitely possible.
When I do the same thing as above for baseball, I get 29.1%, and the observed variance of win totals is quite large (138.14 over the past 10 years).
Sorry, HFA=.54, not .50.
The variance for 16 random 50/50 wins is indeed as calculated above. However, this is really the variance for a single average team out of the league, over the course of many years playing other average teams.
However, the number you take from the data is over the whole league (averaged over 10 seasons.) Over the whole league (of average teams with no HFA) in a given season, there is an additional nontrivial constraint--namely that every game has exactly one winner and one loser. This is a little different from 16 independent coin tosses for each team, as 16 independent coin tosses for each team effectively allows games with two winners and two losers.
The full league will have various strong correlations among sums and this will change the variance. One could probably calculate in closed form what the effect is, though it would probably be simpler to simulate (in Excel for instance.) For what it's worth, the effect on the variance is surely between a factor of sqrt(2) and sqrt(256/255) but without putting actual effort into it I personally can't nail it down any more tightly--though maybe one of your other readers can.
For the QB study you plan to do next, I think you're going to find a very surprising result. As far as I have ever seen, at least over single seasons there is generally no discernible effect outside the binomial variance. If you're not careful, some seasons you might even find imaginary standard deviations :)
Like borrowing interceptions from the future? :)
The constraint you mentioned, which I hadn't considered and I'd agree should be important, doesn't appear to have a large effect. I did the simulation you suggested a few years ago (linked to in the post above) and got very similar results (r of .75). But I'd like to think about it more...
Actually, I don't know if the constraint is important--if it's at the sqrt(256/255) end, then it isn't. I'm reasonably but not completely sure that the effect on the league variance depends on the network structure of which teams play each other. But you have done precisely the simulation I had in mind, including that network structure, so you could numerically work it out--just calculate the variance you see in that simulation (I didn't see the number given anywhere in the posts) and compare to 0.125^2 .
Though you phrase the question here in terms of the relative level of perfect luck and perfect skill, personally I would phrase the question a little differently, and in two parts. The first part is--measured in some assumed true-and-constant underlying "power-ranking" type units like points, what is the variation among NFL teams in those units? The second part (and the somewhat trickier concept) is, suppose the true power ranking for a team were even known, what is the expected variation in point-spread outcome if it were to play the same (league-average) team over and over? The "excess variance" of wins-and-losses can be backed out via simulation with these two numbers, essentially it will work out to be a (nonlinear) function of the ratio of those two numbers.
FWIW I peg these numbers (the standard deviations) at about 5 points and 14 points, respectively.
I was thinking about this a bit more and I have a question about probability that I've had a hard time sorting through in my mind. I understand very well the problems of small sample sizes. And I know that if you flip a coin 16 times, more often than not, you will not get a perfect 8-8 record.
But 16 games are not analogous to 16 coin flips. They are more analogous to 16 buckets of ~150 coin flips. In other words, a game is the sum result of many different plays. I know that it's not a simple equation - just because you "win" more plays than you lose doesn't necessarily mean that you will win the game. But wouldn't the deterministic value of 16 games (or even 10 games) be worth much more than the deterministic value of 16 coin flips?
Adam, I think your idea is interesting. I think you could probably come up with a crude model that works like this: treat a football game as 101 (to avoid ties) weighted coin flips, where team A has the same probability X of winning each coinflip. Whichever team wins more coin flips wins the game. Suppose that, based on Brian's models, team A has a 57% chance of winning the game (perhaps the teams are completely even and team A is at home). That means that team A's chance of winning each individual flip (X) is only 51.9%, much closer to 50% than their chances of winning the game.
So think of each play as a coinflip that the favorite has just slightly better than a 50% chance of winning- over time those odds add up.
For instance, using this model, a team with a 75% chance of winning the game has just a 54% chance of winning each play or coinflip.
Sorry I made a small error with my calculation. In fact, team A needs only a 50.9% chance of winning each coin flip to have a 57% overall chance of winning the game. And with just a 53.3% chance of winning each flip, team A would have a 75% chance of winning the game.
Everything I learned about statistics comes from reading football sites on the web
What does this mean for game predictions? If 41% of a team's record is due to randomness than wouldn't you expect that you couldn't predict the winner of any given game very accurately?
How can your model say that one team has a 90% chance of winning when 41% of the result is due to randomness (and thus can't be predicted)?
weisteinium-41% of the variance in NFL season-long w-l records can be accounted for by sample error. That's across the league as a whole.
Variance is a somewhat abstract concept. That's why I put things in terms of a correlation coefficient, r, which came to 0.75 for team ability.
Hope that helps.
So individual teams may have a far larger chance of winning a selected game depending on the opponent and whether it is a home game.
What this suggests in terms of prediction models is that even a perfect model could not exceed 75% accuracy by very much.
Adam-very true. A game is the sum of smaller partially random event. And those events are the sum of even smaller partially random interactions, and so on.
Have you seen one of those pachinko-machine exhibits at a science center or in school that demonstrates the normal distribution? (It's actually the binomial distribution, by the way). In them, a series of balls are dropped from the top and bounce off of several evenly spaced pegs on their way to the bottom where the balls collect in bins. The number of balls in each bin will conform to a binomial distribution because they are the sum of several semi-random interactions.
Anyway, each layer of pegs can be thought of as another layer of a binomial process--game, play, player, etc.
Randomness and Luck vs Free Will
I like the overall concept ANC approach here and in the prior, linked posts.
The comments on transitivity and ranking issues got me thinking. The use of a coin flip as an example obscures the reality that these aren't "start them, stand back and let them happen events."
How much of the variance is the result of coaching? (I don't like military analogies but...) smart bomb vs World War 2 era bomb.
Brian, dunno if you're monitoring these older threads, but how much do you think the apparent "parity" of the NFL is due to this effect -- for example, as indicated by postseason success -- given the randomness of a single-elimination tournament format?
I think a great deal. The better team actually wins more frequently in football than in baseball. It's just that baseball has 10 times as many games for all the breaks to even out.
Brian--
I just applied some of the concepts here to the Lions' current season, if you're interested.
http://www.thelionsinwinter.com/2010/11/detroit-lions-nfl-and-luck.html
Peace
Ty
Math models aren't very good if they don't match reality. Those who predict outcomes in NFL games can routinely be correct over 70% of the time (season after season, i.e. with larger sample size). So randomness cannot account for as much as this article indicates.
Comments that don't match reality aren't any good either.
First of all, there is no predictor who can reliably and consistently predict NFL winners > 70% of the time. Unsupported claim.
Second, a "favorite" team will win by luck 50% of the time. In other words, the starting point for any model is 50% accuracy, not 0%. So a predictor that is 70% accurate is only adding 20 percentage points of knowledge, not 70.
Hi, Brian. I wrote something that disputes a few of the things you are saying here. Thought you might be interested to see it:
http://www.reddit.com/r/NFLstatheads/comments/138skh/original_research_luck_predictability_and_the/
Hey Brian,
Pats fan here so take this for what its worth, but I don't believe the pats with Brady and Belichick have the variance you describe with regard to wins from one season to the next. Neither do Peyton Manning led teams, would you say that 58% is a bit low in some instances?
25% would be closer to the truth, not 24%.
Hi Brian,
I'm trying to apply your analysis here to National Rugby League (NRL) games in Australia. In the NRL there are 16 teams that play 24 games over each season.
What would the theoretical binomial variance be here for this competition?
I used a binomial variance calculator using 24 trials with p=0.5, which gave me a variance of 6.0. I take that as equaling 0.25 (6/24). Is this correct?
Mark