

I'll first air the assumptions and limitations. This analysis is based on contract/salary data provided by Spotrac.com. I've limited the years of analysis to only 2010 and '11 because that was the sample of data made available. More years of data could always be added to refine the results. +Expected Points Added per Game (regular season only) is used as the basis of performance because although it's far from perfect, it captures the impact of individual contribution to game outcome without sensitivity to situational variables beyond the control of the player. It also happens that +EPA/G fits best with the salary data, so it is the measure player performance for the purpose of this analysis. Lastly, due to the complexity of contract incentives, bonuses, guarantees, and duration, I have chosen annual 'cap hit' as the measure of contract cost.
That's a lot of assumptions, I realize. But the real world is messy, and the purpose here is to establish the general market--a starting point for further adjustments. As you'll see, the relationship between +EPA/G and cap hit is fairly strong, suggesting the assumptions aren't unreasonable. We should also recognize the distinction between observing what players tend to be paid and what they ideally should be paid.
The chart below plots the cap hit according to the +EPA/G of safeties from the 2010 and 2011 seasons. The correlation between cap hit and +EPA/G is 0.6, which is remarkably strong given that there is always a disconnect between expected and actual performance. Plus, there is all the randomness of a short, 16-game season.
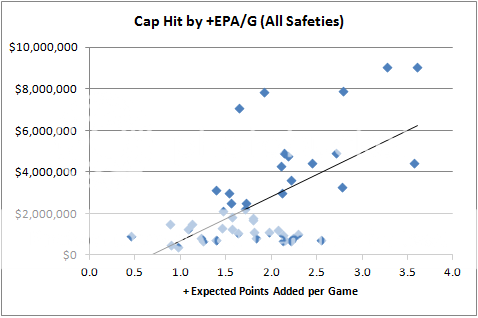
The above chart includes all the safeties for whom I had contract data. But you'll notice a very large cluster of players in the lowest salary range, comprising mostly rookies or other players under minimum contracts. There's a wide dispersion of performance in this range, indicating performance and salary are not closely coupled for these players.
The original premise of this analysis is interested in top free agent players, so it probably makes sense to ignore the low end of the market. From this plot, we can see that about the rookie minimum of about $400k/yr buys you an average +EPA of about 1.0 points per game. But if you up the salary just a little, to about $700k/yr, you can buy a lottery ticket for anywhere between 0.5 to 2.5 +EPA per game. These are probably your mid-round draft picks or bargain basement veterans. This wide range shouldn't be surprising because of the uncertainty in expected performance of rookies, plus the fact that rookies are artificially underpaid while veterans have a higher minimum salary. Replacement level at safety is probably somewhere near the midpoint of that range, at about +1.5 EPA/G.
Above this cluster, there appears to be a clearer linear connection between salary and performance. Removing all players with cap hits below $1.5 million per year results in the chart below. The correlation increases to 0.68, and more importantly, it better represents the free agent market for top safeties.
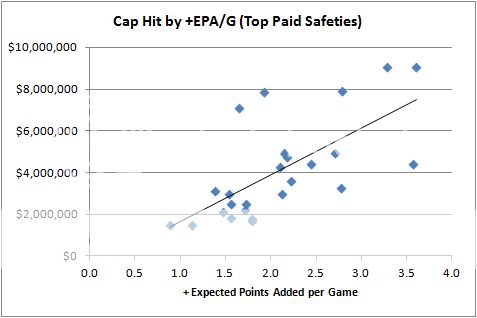
It appears teams are willing to annually pay $2 million per +EPA/G - $170k. So a player like Troy Polamalu, who has averaged 3.2 +EPA/G since his sophomore season, should be worth an annual cap hit of 2 * 3.2 - .17 = $6.2 million. His actual hit is about $9 million. That's not to say he's overpaid. His full performance is certainly not captured by +EPA/G, however, that's true of all safeties. His share of un-captured performance would need to be far greater than other top starting safeties for that to explain the discrepancy. And that's a case that could be made on several fronts, including dependability, health, age effects, team needs, off-field marketing value, etc.
But a reasonable starting point for a safety of his expected performance should probably be close to $6.2 million, and adjustments can be made upward or downward from there.
There are several additional considerations. In addition to things like age and health, there are concepts like discount rates. Teams, like people, are usually willing to pay later for services rendered now. The league's new TV contract ensures payrolls will expand, so there is salary cap inflation to consider. There is also the Gladiator Effect. Defenses usually want only two safeties on the field at a time, so a single great safety can't be replaced by four or five average ones.
Improvements to the methodology would include a more rigorous analysis of who the players are, what their contract types are, adding more years of data for better context, and possibly correcting for the heteroskedastic relationship between salary and performance.
Anyway, I know this is wrong. I just hope it's not all wrong, and it's close enough to correct that some smart people can help refine it.


Wouldn't the gladiator effect result in a non-linear chart? In fact, this may be what we are seeing.
The actual line may be curved upwards towards those top two datapoints. It might be necessary to look at the shape of the graph for all the other positions in order to better judge whether this is the relationship we should be looking for.
What I would interpret from this chart is that there are two safeties who are extremely overpaid (top left at about $7-8m) and one who is underpaid (high performance at just over $4m)
I am not so convinced about the gladiator effect for any position in Football apart from QB maybe. While you may not be able to replace one topflight safety with several average one, you can replace him with an average safety and an upgrade of your DE from average to good. Or you can use the money kept above average backups at DL/LBs.
It's an interesting question. If I had a $10mil budget for starting safeties, would I rather pay someone like Polamalu or Reed $9.2mil and gamble with a rookie or minimum veteran, hoping my superstar stays healthy and the rookie performs... or would I pay two safeties $5mil and confidently expect 2 EPA/gm?
Also, is EPA additive? If I had both Polamalu and Reed, and each's true-talent is 3 EPA/g, would that stack to 6 EPA or is there a loss because they would occasionally cannibalize each other's plays? Or is it more than 6 because it would allow the other to play more aggressively?
Brian,
Quick question ... how do you attribute the EPA to the safety? The entire team's EPA on the play? Only on plays where the safety gets the tackle? Something other?
Sorry if this is a question that's already been answered.
Phil-It's explained in the 'Measuring Defensive Playmakers' link.
http://www.advancednflstats.com/2010/03/measuring-defensive-playmakers.html
Bottom line is that, in football, we can only measure the 'plus' side of defensive EPA and WPA, and trust that high +EPA correlates with low -EPA. We know that's not true in all cases, but it's the best that can be done with stats alone.
Thanks! Good explanation at that link, I like the logic.
Still one question: do you measure +EPA only on plays in which the safety made a tackle? Or on all plays, regardless?
Anytime the player's name shows up in the play-by-play--tackle assist, pass defended, int, sack, etc.
Brian, your point about rookies is well taken, but why not just screen them out rather than imposing the cutoff? Cheap free agents exist, and must represent the bottom end of the talent spectrum. You've probably thrown away some signal there.
One thing about the NFL is that teams are also working within the constraints of the salary cap. So although there might be a Gladiator Effect when you look at individual players, the pay of each individual player is a compromise with what is available after the other players on the team are paid. It might even be possible to look at a team as a system of these linear equations and try to optimize them in terms of EPA/G.
I'd be interested to see what the slope of the cap hit by EPA/G for the other positions on a team might be, and whether the slope changes for a given position from year to year.
There's always going to be a problem with outcomes like this, since you've got a regression line that suggests that safeties with a 0.5 EPA/G should be paying for the right to play. A couple thoughts:
1. Try rescaling the salary values using a log transformation of some sort (log_2 or log_10 maybe?) when fitting the regression line.
2. Maybe switch the x and y axes?
3. It doesn't look like a linear fit is going to make much sense. Maybe use a cubic fit?
I'm not even close to thinking this through, but... since football has greater revenue sharing than baseball, you're not going to have cases where a team can just simply buy themselves better talent than another team year after year.
So that means that every team has an equal "shot" at getting a team that is more talented (through value acquisitions) than any other team, either through value acquisitions, or better allocation of talent. As for allocation, say every team had an equal number of talent units. Wouldn't you want as many of those talent units on the field at the same time? Like, clustered into your top 25 players to a greater degree than other teams, and especially clustered towards every-play impact players.
For that reason, you're going to find an extra competitive market towards the players that have a lot of talent units. So you'd expect teams to overpay for them. I mean, a perfectly efficient team with quality depth isn't usually going to win over an uninjured team with crap depth and a couple of overpaid but highly talented every-play players.
Related to your point above, I have a question about the salary data that this is based on. Depending on what is included in that data, there might be noise that would greatly influence the outcome. I think it might make more sense to use cap hit per game, rather than cap hit per season, but it's difficult to see without knowing what the underlying data looks like.
First off, a player should never make less than the league minimum, which changes by year. This sets a floor on your graph, which means that a straight line isn't going to perfectly fit your data. At the very least, it's going to look like a hockey stick. I'm not sure that you're going to be able to get enough data to tell what a perfect fit might look like, so I'm not particularly concerned about what the underlying function might look like.
I raised the point above about looking at this information in terms of comparisons between positions and I think that it would still be useful there, because you would be making the same assumptions when you compare the different positions.
Back to the questions about the underlying cap data and why I think that cap hit/game might work better, my understanding of the way that cap hit works is that a certain amount of cap hit is linked to the number of games a player is on the roster and a certain amount is going to be paid to players that are on IR or even cut. Unless you can account for this, you are probably going to end up with distortions.
Just as a hypothetical, lets say a player gets $1m and plays 10 games with a 1.5 EPA/G, he would show up as a much different point on the graph than a player who is signed with 3 games left in the season for $300k and plays 3 games with a 1.5 EPA/G. Both made 100k per game, but just from a cap hit per season point of view they show up differently.
Again, I haven't really looked at the data so I don't know what these issues might be and how they can be corrected for.
Also, there might be some different data available through another source, I did see this
http://content.usatoday.com/sportsdata/football/nfl/salaries/position/S/
This has past information for 2000-2009.
I think this is brilliant. Real life data is always going to be a bit sloppy. I just wish I knew a team was employing this type of analysis. I would root for them.
I've done more basic evaluations for my fantasy football leagues. We run an auction draft so it retains the concepts of salary cap and player performance. Of course its a lot easier to measure player performance in fantasy football because we have a set scoring system for player stats. The calculations do make it easier to find gaps in the market value for players. It helps to create a strong team.
I'm still not convinced that all positions fall in the Gladiator realm. I'd imagine that there are trade-offs. I may only need one free safety but I also need multiple DE. A team that has a stockpile of DE can continue to substitute them in and avoid fatigue. If I had one amazing DE and a bunch of scrubs the offense could just chipblock my DE or double team him and nuetralize his ability. It seems like the 11 defenders on the field work as a single Gladiator since you can not have more than 11 players. But the individual parts need to work together. Just one star doesn't work on Defense when you have a gaping hole somewhere else. Remember the Packers/Falcons playoff game. The Packers were clearly the better team and we knew that from the advanced stas prior to the game, but they also picked on Chris Owens badly.
I can have amazing cornerbacks and hope to cover long enough that my average D line can get a "coverage sack." Or I can have an amazing D line that gets to the QB so quickly that he doesn't have time to expose the weak secondary.
I'm not sure which is the correct philosophy. We know the difficulty in establishing metrics for individual defenders so it makes sense that there is some constructive/destructive interference occurring.
While writing this I may have just come up with an idea. I know its not perfect. But has anyone conducted a multi-variate Taguchi style experiment using positions or groups of positions as variables. It would be pure simulation but I wonder how good some of the game simulators are if you could create your own roster. It may help determine the interactions between positions. Or maybe, given enough historical data we may have all the info we need to calculate the interactions between positions.
I could use a video game to run the simulations but I fear that all it will tell me is which team to pick to defeat the computer.
I often calculate EPA/play for CBs. My thought is that good CBs will be avoided and poor ones will be targeted. EPA/play corrects for the differing amounts of chances to make a play and gain EPA. I calculate the number of plays by adding up the number of tackles, assists, passes defensed, interceptions, etc.
If you like this concept, it could be useful for safeties. I wonder if it correlates better with salary than EPA/game.
PS: Playing with the comment system. Making a mess.
The problem with this measurement is that it over-rates gambling. Take Goldson of the 49ers.
Your system clearly didn't penalize him for all the big plays he gave up. Against the Cards, the game they won, Goldson's mistakes gave up 2 TDs and set-up a third. Plus his failures lead to close to 200 yards of passing offense. And that's not the only bad game he had. Just the worst.
Worse, he's not the only safety or cornerback to become over-rated by this 'positive play' grading metric. Champ Bailey spent years giving up a 64% completion rate and 8TDs a season to the likes of Joey Porter and Eddie Kinneson, but getting to the probowl by jumping routes and getting two or three TD INTs a season... While corners who played much better were ignored for the Champ Bailey Hype Machine.
So, until you can penalize the players in coverage for their mistakes... The negative EPA you're missing can incredibly significant, to the point of the lack of inclusion can be paint a picture that is completely misleading.