
 The previous post looked at one way of assessing the success of a football play, namely, by measuring the increase or decrease in the probability of getting a first down. We saw that, in general, an offense needs at least 5 yards on any play to break even in terms of its probability of getting a 1st down. I’ll continue the discussion by looking at another measure of utility called point expectancy.
Every spot on the field has an abstract value in terms of points. We can begin assigning values at the end zones, where having the ball has a clear and concrete value. Possessing the ball at the opponent’s end zone is worth (nearly always) 7 points. And having the ball at your own end zone is worth -2 points.
Every other yard line has a point value too. We can measure it by averaging how many points will be scored next. For example, having a 1st down and 10 from an opponent’s 20 yard line is worth, on average, about 4.2 points. Often the offense will score a touchdown, and failing that, it is likely to be able to kick a field goal. But sometimes, the offense will fail to do either, and the opponent may be the next to score. In other cases, neither team will score immediately, and they will exchange possession until someone does score. This is something I’m used to watching as a Ravens fan.
The concept of point expectancy originated with the work of Virgil Carter, a former NFL quarterback who studied operations research in the early 1970s (while an active player). Carroll, Palmer, and Thorn adapted the concept in their 1987 book The Hidden Game of Football.
One flaw in the early applications of the concept was the assumption of linearity. Both Carter and the authors of Hidden Game planted stakes for the obvious point values at both end zones and then drew a straight line between them. We’ll see that isn’t exactly right. Additionally, things change in the 4th quarter as teams with leads become conservative and teams that are behind trade overall scoring optimization for urgency.
The graph below plots the expected points for a 1st down at each yard line. For simplicity, I’ve named each yard line in terms of its distance from an opponent’s end zone. Having the ball at one’s own 20 is “the 80 yard line” for example.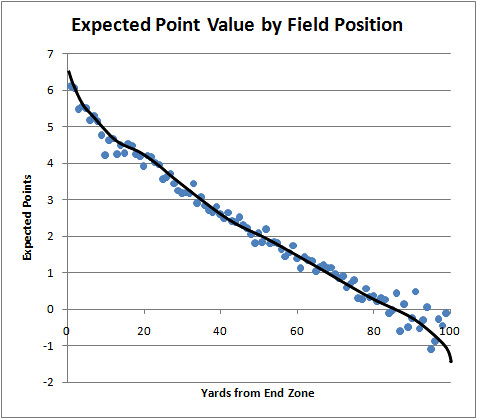
One immediate application of point expectancy is measuring the cost of a turnover. If an offense loses a fumble at the 50 yard line, the expected point value swings from +2 to -2, a difference of 4 points. Or we can measure the value of a punt. If a team punts for a net 35 yards from its own 35 yard line (“the 65”), the expected point value swings from +1 to about -1, a difference of 2 points. In this regard, we could say that a turnover (at the 50) is 'twice' as bad as a punt.
Expected points is also the methodological basis of the Romer paper on kicking vs. going for a first down. In it, the author measures the expected point value of attempting a field goal or punting vs. the expected point value of ‘going for it’ on 4th down. Romer also points out that touchdowns and field goals are actually worth 1 point less than we think. Unless a score takes place with very little time remaining in a half, the other team will receive a kickoff, worth on average about 1 expected point if they have enough time remaining to mount a scoring drive. Touchdowns and field goals are not quite as valuable as thought, at least in abstract terms.
I should point out that a turnover has different values at different parts of the field. This is something researched early on at the Football Outsiders site. For example a turnover in the red zone, say at the 10, results in a swing from +5 to about +.25, for a difference of 4.75 points expected.
We can see that the neutral point on the field is at a team’s own 15 yard line. There, it’s equally likely that either team will be the next to score.
Things become more complicated when we consider other down and distance situations. Suppose at any given yard line, a pass falls incomplete on 1st and 10. Second down and 10 represents a drop off of about 0.5 points expected. Second and 9 represents a slightly smaller drop off, until at about 2nd and 5 when the expected points are approximately equal to those for 1st and 10. This is consistent with the 1st down probability method I described in my previous posts. Third down and 10 represents a further drop off of about 0.5 points. Another complication is that various teams have different curves. Defenses would each have their own curve as well. When using point expectancy to weigh decisions about kicking or going for a first down, each team would have to take into account its own and its opponent's unique expectancy curves. Take for example the Ravens and Colts over most of this decade. Each team is typical of opposing extremes--great defense, mediocre offense, and vice versa.
A drawback to this method of measuring utility in football is that it does not consider time remaining. In other words, it assumes that every game is indefinitely long and the object for each team is to maximize point differential. But this is not how football really works. Take the case of a team trailing by 4 points late in a game. A touchdown is essential, but a field goal would be pointless. Even on 4th and very long, it wouldn't make sense to purely maximize "expected" points by kicking. For the vast majority of situations in football, however, this method would be adequate. This brings me to the next method of measuring utility in football—win probability. I’ll discuss that in a forthcoming article.
Expected Points
published on 8/03/2008


Subscribe to:
Post Comments (Atom)
Have you ever considered trying to work other factors other than field position in, such as down and distance, timeouts, time on clock?
Emperically, it would cut the data to thing, but we have set up our NES models to incorporate regressions to help value the relative effect (and 2nd order effects
-Mark mkamal@protrade.com
Just found the site and I love it. Question on the above article - Romer says that a score is actually worth 1 point less than you think because the Opponent will take possession afterwards. Good point, but if the Opponent takes possession and scores then they will give possession back to the Original Team and if the Original Team scores they will give it back to the Opponent and so on and so on. My question is it you take the ball on the 70yd line and have a 1 pt expectancy(chart above), is this negated by the fact that you will be giving your opponent possession after you score? Or to ask it another way, At what yard line am I indifferent possesing the ball or having my opponent possess the ball?
The chart above is a little different than Romer's. It should be about 0.7 points lower to account for the kickoff to the other team.
The line of indifference should be about the 15.
Brian,
Nice work with this site.
Clearly the expected point value distribution above would only apply to a 'pick-em' game with an average expected number of total points (say 43). Have you tried working on a model that takes into account the driving team's % probability of winning the game, and the expected number of points in the game, as additional factors in determining the expected points value of a drive?
meeeeee,
the expected points for your team is 0 if you possess the ball at your own 15 yard line. however, you are not indifferent between your team and the opponent having the ball at your 15 yard line for their expected points would be approximately 4.5 points. This would clearly be a disadvantage for you. I think what Brian means is that you are indifferent between possessing the ball at your own 15 or the opponent possessing the ball at their own 15 because the expected points are equal at 0.
Brian,
I like your work. You explain economic concepts very clearly. Thanks for making a cool site.
I am the guy who asked the question above on January 12 2009. I still don't quite understand. If you score and give possession to your Opponent (with a 1 pt expectancy) and he scores and gives you possession and the 1 pt expectancy back to you. Doesn't this all cancel out? So Romer would not be correct because any point expectancy you give to your opponent will be handed back to you.
Thx
Yes, it would cancel out. But keep in mind your condition: "and he scores." That's not a given. You might be the next to score (scoring twice in a row), so you can't assume alternating scores. Therefore, you have to account for the kickoff.
Another way to think about it is if you consider a safety. A safety is 2 pts, but the scoring team gets the ball back and does not kick off. That obviously has positive value, and therefore kicking off to the opponent after a TD or FG has a similar negative value.
Also, the yard line of indifference is the 15. That's where the black line in the graph above intersects with zero points. A team would be indifferent to having the ball at their own 15 or their opponent having the ball at the opponent's own 15. There is no yard line where a team would be indifferent to a turnover.
I think instead of subtracting a point, you should subtract half a point. No matter if you score or not, you're returning the ball at the end of your possession.
Upon kicking off you know that from this moment forward each team will have either the same number of possession, or the opposing team will have one more. Thus when receiving a kick-off you should add 0.5 pts to the receiving team and subtract 0.5 pts from the kicking team.
Whenever analyzing a point expectancy for a team, you should subtract 0.5 for the ensuing return of possession. The exception is if you have reason to believe that it's not 50/50 who will have the final possession (late in a game, for instance).
Brian, do these point expectancy make any account for the expected field position of the opponent when the ball is returned? It seems like the answer is yes based on the 15 yd line being break-even, but it's hard to tell.
Justin-Very interesting. I never considered the prospect of uneven numbers of possessions.
This is kind of an old post, so I don't recall if the graph above makes the kick-off adjustment. I doubt it. The more recent '4th Down Study' post I just put up does feature a graph that definitely does has the adjustment.
One of the reasons I love going for it on fourth down from the one or two is partially explained by the above chart. You have to subtract the negative expectation from the 3 points. For example, if a possession 99 yards from the endzone has an expectation value of -1 points, then a field goal from the 1 is only worth 2 points. This is because if you just handed the ball over you have an expectation of 1 point (the other team's expectation is -1).
This means that instead of the conventional wisdom, which might be that you need a 3/7 (43%) or better conversion rate to break even, you actually only need a 29% (2/7) conversion rate.
This is an oversimplification, of course. It neglects the emotional aspect of the boost a goal line stand might give your opponent. But, particularly for teams with good defenses, going for it on 4th and goal from the 1 or 2 almost always makes sense.
Brian, how does forcing a punt (via 3 and out), lets say at an offense's 25yd line, result in "better field position" for the other team's offense? I know it gets the ball back, however, how is it necessarily in better field position for the other team's offense? How about comparing that situation to lets say holding an offense at the 50 yr line by forcing a 3 and out. Does the other team's offense get better or worse field position?
In the first situation the punt could result in a kick lands on the opposite 20yr line (no runback) and in the second situation, the punter hits the touchback and so its on the 20 also.
Basically what I am trying to ask is forcing 3 and outs helps get the ball back, but does it necessarily get the ball back in a "good field" position? The next question should probably be does it matter where a defense forces a 3 and out?
Also, why is the value of a TO worth more on 1st down compare to 2nd and 3rd down?
Thanks Brian,
John
Is there anyway you could post exact numbers for the expected point graph? It is hard to get accurate number just looking at the graph.
After watching the Ravens fiasco last night I'm curious whether you've ever been able to have a look at the EP impact of various penalties? Sorry if it's posted already and I just missed it.
Seems to me that most teams (and certainly announcers) don't have a good handle on just how costly some of these penalties are.
Holding on 1st and 10 seems innocent enough but is really quite costly. (0.8 pts if I'm using your calculator correctly) Even worse if it happens on 3rd and 1.. Running into the kicker on 4th and 3 looks like couple points easily.
Is there a hierarchy of horrible penalties?
Is there an analysis that breaks down the probabilities of the next score being a TD, FG, (safety too for that matter) for both the offense and defense based on field position?
I like Chris's idea. I hope Brian can get around to it someday.
I'm down with the idea of expected points, but I'm curious about using them to evaluate coaches' choices in game situations, especially 4th and short.
Let's say I have a game that gives you an expected value of 10 times the money you bet (e.g., flip a coin; heads win 20x your bet, tails lose it all). Most people would be willing to bet $1 or $10, but most would not be willing to bet $1000, even though that gives them expected winnings of $10,000, which is 100x more than their $10 bet. The utility of winning $10,000 is influenced by the possibility of losing the $1000 bet. It would be interesting to do some modeling to see if you can determine the Utility of the Expected Value for NFL coaches. It's often modeled as f(x) = x^(1/2) or f(x) = ln(1+x).
Very interesting stuff. Do you have the data to break down expected points based on the down as well? Specifically, I'd love to know what's worth more: 1st and Goal from the 10 or 1st and 10 from the 11, 12, 13, etc. I have a suspicion that 1st and Goal from the 10 is worth fewer points, but it's obviously difficult to know for sure.