Showing posts with label field position. Show all posts

Field Position Proves Crucial In Week 1 Tilts

The importance of field position in football is, despite its position as one of the indomitable "little things," still an understated facet of the game. Just take a look at last year's field position data from Football Outsiders. All of the top six teams in net drive start position -- average offensive initial field position minus average defensive initial field position -- won at least 10 games. In 2012, every two extra yards of net field position added an extra win, and net field position explains a whopping 31 percent of the team-by-team variation in winning percentage.


The implication of such a result is clear: as important as pure offensive and defensive talent can be, it can be negated by starting out in poor situations. And, conversely, a team can mask issues on either side of the ball by consistently beginning drives in good position (or, of course, forcing the opponent to begin in poor position). This result was in stark display throughout Week 1, as at least seven games tilted heavily on the field position battle. A focus on three of these contests shows the multiple ways in which the field position game can tilt a contest, as well as the ways a team can influence the field position battle -- of course it's a battle -- as the game goes on.

The following charts show starting field position by drive. The symbol placement shows starting field position and the symbol type shows the result of the drive. The bars show the expected points resulting from the starting field position.

DEN 49 - 27 BAL

How Important is Opponent Starting Field Position?

Earlier this season, I wrote a post about how San Francisco did an excellent job limiting their opponent's starting field position.  After a similar dominant performance against Pittsburgh in Week 15, I decided to revisit this topic.  This year, the 49ers lead all teams in average starting field position for their opponents; their opponents, on average, start at their own 24.4 yardline.  The next best teams? New England Patriots and Green Bay Packers.  In fact, this year, there is a 0.73 correlation between win percentage and average opponent starting field position.

But let's go back.  Since 2000, we see a 0.45 correlation between win percentage and average opponent starting field position.

Expected Points (EP) and Expected Points Added (EPA) Explained

This post will explain the concepts of Expected Points and Expected Points Added. In future posts when I refer to these stats, I'll link here.

Football is a sport of strategy and decision making. But before we can compare the potential risks and rewards of various options, we need to be able to properly measure the value of possible outcomes.

The value of a football play has traditionally been measured in yards gained. Unfortunately, yards is a flawed measure because not all yards are equal. For example, a 4-yard gain on 3rd down and 3 is much more valuable than a 4-yard gain on 3rd and 8. Any measure of success must consider the down and distance situation.

Field position is also an important consideration. Yards gained near the goal line are tougher to come by and are more valuable than yards gained at midfield. Yards lost near one’s own goal line can be more costly as well.

Expected Point Values

Lately I've been using the concept of 'Expected Points' (EP) as a measure of success for football plays. It's been the foundation of much of my analysis of fourth down decisions, onside kicks, run-pass balance, and even touchbacks.

Every down-distance-field position combination has an average net point advantage. For example, when an offense has a first and goal at their opponent's 1-yard line, they can expect about a 6-point advantage over their opponent in the long run. A first and 10 at midfield is worth about 2 EP.

Expected Points on first downs are easy to compute because there are so darn many 1st and 10s compared to any other down and distance combination. Here is the EP chart for 1st and 10 (or goal) from my fourth down study earlier this season.

Where Does the 'Red Zone' Really Begin?

Back when I studied aerodynamics, the first thing we were taught was that we needed to assume air was an incompressible fluid, otherwise the math just gets too hard. But when my trusty old F/A-18 would approach the sound barrier, the air in front of the plane couldn't get out of the way fast enough, and aerodynamically, things got weird. To model the fluid dynamics of the air flow at these kinds of speeds you need to allow the air to be compressible.

I'm running into this exact same problem now as I am completing a big project on 4th down decisions. The compression of the field toward the end zone means defenses have less area to cover, and it becomes harder for offenses to move the ball. The region where this occurs is, of course, called the red zone. But is the 20-yard line really where the compression effect begins? And how strong is the effect?

We could look at average gain per play based on field position, and we’d see this graph where the decline in average gain begins around the 30 and becomes dramatically steep by the 20.


But this would be misleading because the endzone truncates longer plays. There’s no possibility of a 30-yd gain from the 20-yd line, but there is from the 30, the 40, and so on. So let’s look at it another way.

This graph plots the 3rd down conversion percentage by distance to go for three regions of the field: inside the 10, from the 10 to the 20, and outside the 20.


It looks like the 10 to 20 region is very similar to the rest of the field, but the Inside 10 region is where it’s noticeably tougher to convert. But even there the difference is relatively small.

These results could be interpreted another way. If the compression effect occurs at 3rd and 6 on the 15 yd line, then that series began at the 21. Therefore, we might as well say that the effect began, for practical purposes, at the 21.
There are any number of ways to look at this, but this way happens to be what I need for the larger 4th down project.

What's the Frequency, Kenneth?

I was interested in field position, not the theoretical point value of field position, or win probabilities, or anything else dense and cosmically incomprehensible. I was just curious how often the ball was snapped at each yard-line on the field. I was mostly interested because I wanted to see how field positions might bias the results of some of my other number crunching. So I plotted the frequency distribution of field position for every play from scrimmage from 2000 through 2007, and I found something odd.

Below is the distribution. The yard-lines are numbered according to the distance to the goal line. For example, the '70' would be an offense's own 30 yd-line.


The first thing that stands out is the large number of plays at the 20. Of course, this is due to the fact that touchbacks automatically put the ball here. No surprise there.

The next thing I noticed was the sawtooth pattern, a series of smaller spikes extending across the field. At first I thought this was random noise, but then I noticed how regular they were. The pattern wasn't completely apparent to me until I added the vertical grid lines. There is a noticeably higher number of snaps from every 5-yd increment on the field than at other yd-lines.

The spikes at the 25 and the 30, and even the 15 and 10, made sense to me. Since there were lots of plays from the 20, penalties would commonly put the ball at 5 and 10 yard increments from there. But the spikes continue down the entire length of the field, all the way to the end zone. I really doubt chains of penalties beginning at the 20 could account for that.

Could there be lots of series (aside from penalties) that tend to gain 5, 10, or 15 yards rather than 9, 11, 12, or 14? It seems unlikely in the extreme, although I can't disprove it for now.

I'm baffled. If I had to put money on it, I'd guess that because the 5-yd lines represent nice round numbers, and are boldly drawn from sideline to sideline, it's easy for refs to spot the ball there, either intentionally or subconsciously. This would be the case especially if the mark is somewhat ambiguous, such as when a ball carrier slides or a punt sails out of bounds.

There is one interesting exception, too. There's no spike at the defense's 10 yd line, but there is one at the 11 instead. Strange. My guess here is that because there are lots of plays on the goal line (probably due to lots of stuffed runs and/or pass interference calls in the end zone), 10-yard penalties such as holding would force the ball to be at the 11, instead of the 10.

I guess this belongs in the ever-growing category of 'things only I could possibly care about.'

Win Probability

Desperate for football, I'm watching the Hall of Fame Game tonight. There's four minutes left in the fourth quarter and the Redskins are up by 7 over the Colts. Can Jared Lorenzen lead his 4th-string squad to a comeback? I must be the only person in the country who cares. And I only care because I'm developing Win Probability (WP) in NFL football.

WP is simply an in-game estimate of who's going to win based on the current score and other game variables. This post will examine the potential application of WP and will illustrate a first cut at actual WP for various scores and time remaining.

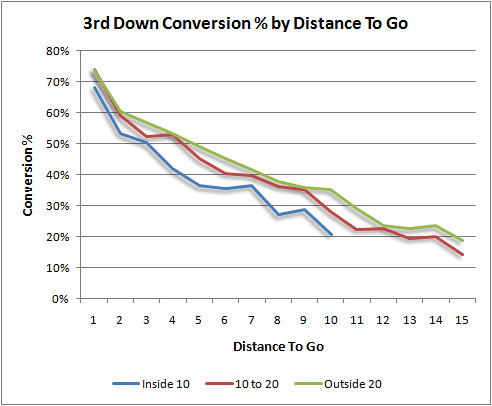
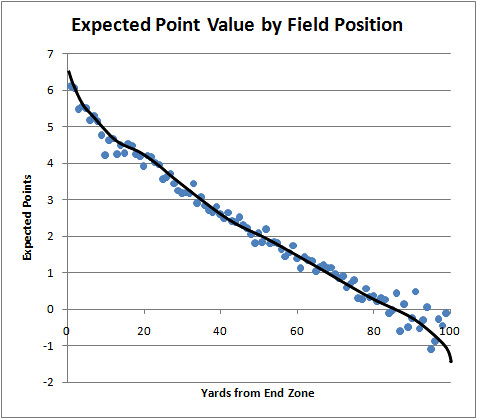
Two of my recent posts discussed measures of utility in football. I looked at first down probability and at point expectancy. First down probability analyzes how likely an offense is to convert their present down and distance situation to a first down. The success of a play can be judged based on how it changes the probability of a first down. Point expectancy measures how many points a team scores on average based on its field position. This technique not only measures success, but can provide coaches with a decision-making tool. We saw, however, that both of these techniques had their limitations.

Win Probability (WP) has been a facet of baseball sabermetrics for many years. In baseball it basically measures the probability one team will win based on score, inning, outs, and runners on base. I suppose the batter's count could be included in the calculations too.

The usefulness of WP goes beyond fan curiosity about whether the home team has a chance to win (but that's interesting in itself). Take a situation in baseball with a team down by 1 run in the 9th inning. There's a runner on first base and no outs. Should the manager call for the steal? WP should instruct his decision. We could calculate the WP of the steal decision by totaling the WPs of the potential outcomes. The WP of the steal decision would be:

WP(steal) = Pr(successful steal) * WP(runner on 2nd, no outs) + Pr(caught stealing) * WP (no runners, 1 out)

This would be compared to the various outcomes of the current at bat without stealing to decide which decision gives the team the best chance to win. There would be analogous applications of WP in decision-making in football.

Baseball is a sport well-suited to WP because it has a limited number of discrete states. There are 27 outs for each team, 3 bases, and 3 outs per inning, and there is enough historical data to accurately calculate the historical WP for each state. Football is far more complex. The states are continuous and non-discrete. For example, compare field position to runners on base. There are only eight (I think) combinations of base runners, but there are 99 yard lines. Or compare each baseball team's 27 outs (54 total) to the 3600 minute and second combinations in a 60 minute football game. There is literally over a billion potential combinations of score, field position, down and distance, and time remaining.

WP in football can be simplified, thankfully. For example, time remaining can be grouped into minute or 30 second increments. Field position could be grouped in chunks too. Even so, there are still so many combinations of states in a football game that a good WP model would need a lot of data. And I'm not talking about an entire season of play-by-play information. We'd need years of data, and even then we'd need a lot of mathematical smoothing and "best fit" estimation.

The graph below is my own first cut at WP for the NFL. It is based on all regular season games from the 2000 through 2007 seasons. For the most common score differentials, it plots the WP of the team with possession of the ball. For example, the top curve, labeled +7, is the WP for a team that is winning by 7 points, and has the ball, at each minute remaining in a game. The -7 curve, at the bottom, is the WP for a team trailing by 7 points and has the ball.

It does not factor in field position or down and distance situations. So, this should be considered a baseline and not a finished product. But already we can see some interesting things.


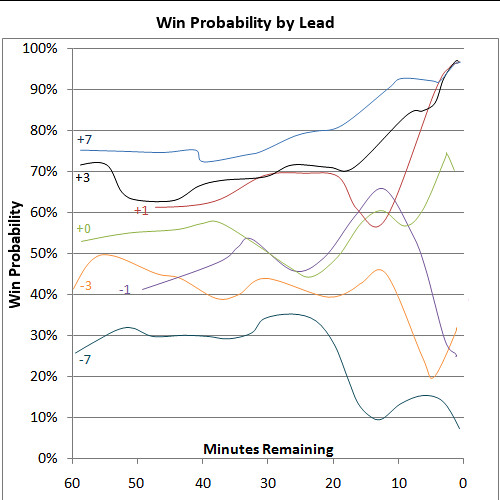
A few things stand out to me right away. Notice the sudden drop off of the -7 curve. A team trailing by a touchdown with 20 minutes left in the game (5 min left in the 3rd quarter) sees its chance of winning fall dramatically. There are similar drop offs for teams trailing by 1 and 3 points at the beginning of the 4th quarter.

Also notice how the WP for a team down by 3 has a slight uptick, from .20 to .30, in the last few minutes of the game. I think this is because if they are able to score and at least force overtime, there is not much time left for the opponents to mount a scoring drive themselves.

One particular surprise is that teams down by 1 point early in the 4th quarter, who have the ball, are actually favored to win. By 7 minutes remaining, the team trailing by a point falls below even odds.

The application of WP could have profound consequences. Take a fairly common scenario. Your team is down by 3 points with 4 minutes left in the 4th quarter. You're facing a 4th down and goal from the 2 yard line. Conventional wisdom screams field goal! Get some points on the board and at least force OT. But WP might say something else. (Keep in mind field position is not considered yet, so this is rough).

If you kick the (virtually automatic) field goal, that ties the score and gives the opponent the ball with just less than 4 minutes remaining. Your opponent has a 70% chance of winning in this situation according to the graph. You've got a 30% chance.

Let's see what happens if you go for it. If a 4th down try for 2 yards would be successful about 30% of the time (which it is, at least for 2007), your PW is the total probability of the two outcomes:


WP(go for it) = 0.30 * WP(+4 point lead) + 0.70 * WP(-3 point deficit)
= 0.30 * 0.92 + 0.70 * 0.22
= 0.43

That's a 43% chance of winning by going for the TD vs. a 30% chance by going for the FG. I think this actually understates the chance of winning by going for it because if you fail, the opponent gets the ball very near his own goal line. So if you get the ball back, chances are you won't have far to go to get back into field goal range.

A lot of work still needs to be done, but the potential for WP in football is enormous.

Expected Points

The previous post looked at one way of assessing the success of a football play, namely, by measuring the increase or decrease in the probability of getting a first down. We saw that, in general, an offense needs at least 5 yards on any play to break even in terms of its probability of getting a 1st down. I’ll continue the discussion by looking at another measure of utility called point expectancy.

Every spot on the field has an abstract value in terms of points. We can begin assigning values at the end zones, where having the ball has a clear and concrete value. Possessing the ball at the opponent’s end zone is worth (nearly always) 7 points. And having the ball at your own end zone is worth -2 points.

Every other yard line has a point value too. We can measure it by averaging how many points will be scored next. For example, having a 1st down and 10 from an opponent’s 20 yard line is worth, on average, about 4.2 points. Often the offense will score a touchdown, and failing that, it is likely to be able to kick a field goal. But sometimes, the offense will fail to do either, and the opponent may be the next to score. In other cases, neither team will score immediately, and they will exchange possession until someone does score. This is something I’m used to watching as a Ravens fan.

The concept of point expectancy originated with the work of Virgil Carter, a former NFL quarterback who studied operations research in the early 1970s (while an active player). Carroll, Palmer, and Thorn adapted the concept in their 1987 book The Hidden Game of Football.

One flaw in the early applications of the concept was the assumption of linearity. Both Carter and the authors of Hidden Game planted stakes for the obvious point values at both end zones and then drew a straight line between them. We’ll see that isn’t exactly right. Additionally, things change in the 4th quarter as teams with leads become conservative and teams that are behind trade overall scoring optimization for urgency.

The graph below plots the expected points for a 1st down at each yard line. For simplicity, I’ve named each yard line in terms of its distance from an opponent’s end zone. Having the ball at one’s own 20 is “the 80 yard line” for example.


One immediate application of point expectancy is measuring the cost of a turnover. If an offense loses a fumble at the 50 yard line, the expected point value swings from +2 to -2, a difference of 4 points. Or we can measure the value of a punt. If a team punts for a net 35 yards from its own 35 yard line (“the 65”), the expected point value swings from +1 to about -1, a difference of 2 points. In this regard, we could say that a turnover (at the 50) is 'twice' as bad as a punt.

Expected points is also the methodological basis of the Romer paper on kicking vs. going for a first down. In it, the author measures the expected point value of attempting a field goal or punting vs. the expected point value of ‘going for it’ on 4th down. Romer also points out that touchdowns and field goals are actually worth 1 point less than we think. Unless a score takes place with very little time remaining in a half, the other team will receive a kickoff,
worth on average about 1 expected point if they have enough time remaining to mount a scoring drive. Touchdowns and field goals are not quite as valuable as thought, at least in abstract terms.

I should point out that a turnover has different values at different parts of the field. This is something researched early on at the Football Outsiders site. For example a turnover in the red zone, say at the 10, results in a swing from +5 to about +.25, for a difference of 4.75 points expected.

We can see that the neutral point on the field is at a team’s own 15 yard line. There, it’s equally likely that either team will be the next to score.

Things become more complicated when we consider other down and distance situations. Suppose at any given yard line, a pass falls incomplete on 1st and 10. Second down and 10 represents a drop off of about 0.5 points expected. Second and 9 represents a slightly smaller drop off, until at about 2nd and 5 when the expected points are approximately equal to those for 1st and 10. This is consistent with the 1st down probability method I described in my previous posts. Third down and 10 represents a further drop off of about 0.5 points.

Another complication is that various teams have different curves. Defenses would each have their own curve as well. When using point expectancy to weigh decisions about kicking or going for a first down, each team would have to take into account its own and its opponent's unique expectancy curves. Take for example the Ravens and Colts over most of this decade. Each team is typical of opposing extremes--great defense, mediocre offense, and vice versa.

A drawback to this method of measuring utility in football is that it does not consider time remaining. In other words, it assumes that every game is indefinitely long and the object for each team is to maximize point differential. But this is not how football really works. Take the case of a team trailing by 4 points late in a game. A touchdown is essential, but a field goal would be pointless. Even on 4th and very long, it wouldn't make sense to purely maximize "expected" points by kicking. For the vast majority of situations in football, however, this method would be adequate. This brings me to the next method of measuring utility in football—win probability. I’ll discuss that in a forthcoming article.

Going for It on Fourth Down

It's 4th down and goal from the 2-yard line in the first quarter. What would most coaches do? Easy, they'd kick the field goal, a virtually certain 3 points.

But a 4th and goal from the 2 is successful about 3 out of 7 times, assuring the same number of expected points, on average, as the field goal. Plus, if the attempt at a touchdown is unsuccessful the opponent is left with the ball on the 2 or even 1 yard line. And if the field goal is successful, the opponent returns a kickoff which leaves them usually around the 28-yard line. It should be obvious that on balance, going for the touchdown is the better decision.

That's the case made by economist David Romer, author of a 2005 paper called "Do Firms Maximize, Evidence from Professional Football." Romer's paper is an analysis of 4th down situations in the NFL. It is quite possibly the most definitive proof that coaches are too timid on 4th down. Romer's theory is that coaches don't try to maximize their team's chances of winning games as much as they maximize their job security.

Coaches know that if they follow conventional wisdom and kick--oh well, the players just didn't make it happen. But if they take a risk and lose, even if it is on balance the better decision, they'll be Monday morning quarterbacked to death. Or at least their job security will be put in question.

In case anyone doubts how much coaches are concerned about Monday morning criticism, just take their word for it. Down by 3 points very late in the 4th quarter against the winless and fatigued Dolphin defense, former Ravens coach Brian Billick chose to kick a field goal on 4th and goal from one foot from the end zone. The Dolphins went on to score a touchdown in overtime. Billick's explanation at his Monday press conference was, "Had we done that [gone for it] after what we had done to get down there and [not scored a touchdown], I can imagine what the critique would have been today about the play call." Billick, a nine-year veteran head coach and Super Bowl winner, was more concerned about criticism from Baltimore Sun columnists than the actual outcome of the game. He'd rather escape criticism than give his team the best chance to win.

Romer's paper considers data from 3 years of games. To avoid the complications of particular "end-game" scenarios with time expiring in the 2nd or 4th quarters, he considers only plays from the 1st quarter of games. So his recommendations should be considered a general baseline for the typical drive, and not a prescription for every situation.

Romer's bottom line is the graph below. The x-axis is field position, and the y-axis is the yards-to-go on 4th down. The solid line represents when it is advisable for a team to attempt the first down rather than kick. According to the analysis, it's almost always worth it to go for it with less than 4 yards to go. The recommendation peaks at 4th and 10 from an opponent's 33 yard-line.


Romer basically measures the expected value of the next score. Say it's 4th and 2 from the 35 yd line. He compares the value of attempting a field goal from the 35 with the point value of a 1st and 10 from the 33 (multiplied the probability of actually making the first down.) He also recognizes that a field goal isn't always worth 3 points, and a touchdown isn't always worth at least 6. The ensuing kickoff gives an expected point value to the opponent. There is a point value to having a 1st and 10 from one's own 25 yard line.

One weakness of the paper is that it dismisses the concept of risk as unimportant. Romer says that long-term point optimization should be the only goal, so coaches should always be risk neutral. But if the level of risk aversion were actually considered, we might find that coaches are more rational than he concludes.

But the paper makes a very strong case that coaches should go for it on 4th down far more often than they currently do. Job security for coaches seems to be the primary reason why they don't. At a meeting with some researchers making the case for more aggressive 4th down decision making, Bengals coach Marvin Lewis responded, "You guys might very well be right that we're calling something too conservative in that situation. But what you don’t understand is that if I make a call that's viewed to be controversial by the fans and by the owner, and I fail, I lose my job."

It would be great if a coach came along and rarely kicked. It would be gamble, but if Romer and others are right, chances are the coach would be successful. And the rest of the NFL would have to adapt. It might only take one brave coach.

The Importance of Field Position

I'm currently reading a copy of KC Joyner's Scientific Football 2007. It's an excellent annual prospectus full of useful stats and analysis, which I highly recommend. KC regularly writes for ESPN Insider. I just read a part of Scientific Football entitled Straight from the Dept of Meaningless Statistics (p.210). KC suggests that average drive starting position is "not meaningful at all." He cites an example comparing the Steelers and Browns in 2006:

"PIT's starting field position was their 26-yd line, which was the worst in the NFL. Cleveland's average starting field position was at their 30-yd line, which was the 2nd best...If the average team has 12-13 drives per game, that would mean each team would have [approximately] 100 drives after 8 games. This means CLE would have a 400-yd advantage in this category.

"Four hundred yards sounds like a lot but let's also put it into prespective. If the Browns had 70 potential field position yards on each of their drives (i.e. they had 70 yds to go for a TD), that would mean they have 7,000 yds to go versus PIT's 7,400. Four hundred yards sounds like a lot until you consider that is in the context of needing to gain 7,000 yards."

At first I began to think about the question this way: 400 out of 7000 yds is about 5%. That's not that much, but as a Ravens fan, I'd gladly accept an extra 5% performance boost to my team's offense. But then I realized that field position is not linear, and percentage would not the best way to conceptualize it.

Think of an offensive drive not in terms of a series of passes and runs, but in terms of a chain of first downs, regardless of how they are achieved. To arrive in scoring position a team needs not just yards, and not just 1st downs, but consecutive first downs. The success rate for achieving a 1st down on each series has been 65% over the past 5 years. So a team's probability of sustaining a scoring drive is 0.65^x, where x is the number of 1st downs needed (which would include the final scoring series as well).

On average, an NFL offense needs 3.7 first downs (including the score itself) to score a touchdown. Therefore, the estimated TD rate would be 0.65^3.7 = 0.20 TDs per drive. (Note: The actual share of drives that resulted in touchdowns over the past five years is very close--19%.)

One way to think of those 4 extra yards is that they would typically require 0.4 more first downs to score. The resulting effect on the probability of scoring is 0.65^4.1 = 0.17. The difference is 0.20-0.17 = 0.03.

A difference of only 3% in the chance of scoring a TD on a typical offensive drive may seem very small, but it has a large impact on points. Given a league average of 12.4 drives per game (according to KC Joyner), the effect on two teams with a 4-yd difference in starting field position would be:

0.17 * 12.4 = 2.1 TDs per game (14.7 points)
0.20 * 12.4 = 2.5 TDs per game (17.4 points)

The result is a 0.4 TD per game advantage to a team with a 4-yd field position edge, the equivalent of 2.8 points per game. But it wouldn't work out exactly that way, because there is obviously no such thing as 0.4 touchdowns. So sometimes a team would end up with an additional TD, sometimes not, but perhaps sometimes 2 additional TDs. In my view, this effect is very meaningful.

Here is perhaps a simpler way to conceptualize it. Instead of saying the team with lesser starting field position needs 0.4 more 1st downs per drive to score, we could say that they need a full additional 1st down in 40% of its drives.

The resulting probabilities of successful TD drives are somewhat simpler to understand. This time I'll say the average # of drives per game is 10, which I believe is closer to the actual number than KC's 12.4 number.

0.65^3.7 = 0.20 probability of TD drive
0.20 * 10 drives/game = 2.1 TD drives/game

0.65^3.7 = 0.20 probability of TD drive
0.65^4.7 = 0.13 probability of TD drive
0.20 * 6 drives/game + 0.13 * 4 drives/game = 1.7 TD drives/game

Again, the difference is 0.4 TDs/game.

But we still need to consider field goals. Drives that stall just shy of the end zone are typically converted into field goals. So the estimated difference in expected points due to touchdowns would be mitigated by the expected consolation of 3 points for the team with the worse starting field position. That is, until we consider that the team with better starting field position would also get into field goal range easier themselves. The effect of field goals is essentially a wash.

This is a league-wide general analysis. I've used a lot of words such as typically, on average, and expected. For individual teams, there are a lot of other variables, the most significant of which is 1st down success rate--65% is only the league average. For example, the 2006 Colts' 1st down success rate was 79%. In contrast, the Buccaneers' success rate last year was only 59%. That's going to have a stronger effect on the probability of scoring than starting field position. But those 4 yds still matter a good deal.

Post Script--I asked KC Joyner about this topic. He pointed out that by "meaningless," he was referring to the statistic of starting field position due to its lack of context, and not field position itself.