
 I was interested in field position, not the theoretical point value of field position, or win probabilities, or anything else dense and cosmically incomprehensible. I was just curious how often the ball was snapped at each yard-line on the field. I was mostly interested because I wanted to see how field positions might bias the results of some of my other number crunching. So I plotted the frequency distribution of field position for every play from scrimmage from 2000 through 2007, and I found something odd.
Below is the distribution. The yard-lines are numbered according to the distance to the goal line. For example, the '70' would be an offense's own 30 yd-line.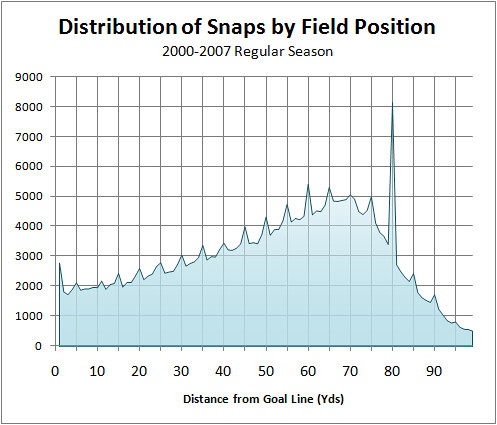
The first thing that stands out is the large number of plays at the 20. Of course, this is due to the fact that touchbacks automatically put the ball here. No surprise there.
The next thing I noticed was the sawtooth pattern, a series of smaller spikes extending across the field. At first I thought this was random noise, but then I noticed how regular they were. The pattern wasn't completely apparent to me until I added the vertical grid lines. There is a noticeably higher number of snaps from every 5-yd increment on the field than at other yd-lines.
The spikes at the 25 and the 30, and even the 15 and 10, made sense to me. Since there were lots of plays from the 20, penalties would commonly put the ball at 5 and 10 yard increments from there. But the spikes continue down the entire length of the field, all the way to the end zone. I really doubt chains of penalties beginning at the 20 could account for that.
Could there be lots of series (aside from penalties) that tend to gain 5, 10, or 15 yards rather than 9, 11, 12, or 14? It seems unlikely in the extreme, although I can't disprove it for now.
I'm baffled. If I had to put money on it, I'd guess that because the 5-yd lines represent nice round numbers, and are boldly drawn from sideline to sideline, it's easy for refs to spot the ball there, either intentionally or subconsciously. This would be the case especially if the mark is somewhat ambiguous, such as when a ball carrier slides or a punt sails out of bounds.
There is one interesting exception, too. There's no spike at the defense's 10 yd line, but there is one at the 11 instead. Strange. My guess here is that because there are lots of plays on the goal line (probably due to lots of stuffed runs and/or pass interference calls in the end zone), 10-yard penalties such as holding would force the ball to be at the 11, instead of the 10.
I guess this belongs in the ever-growing category of 'things only I could possibly care about.'
What's the Frequency, Kenneth?
published on 10/09/2008


Subscribe to:
Post Comments (Atom)
Very, very interesting. That does seem odd how regular that is, all the way down the field.
One question for you: where did you get a flat file of all the games?
I built it by parsing gamebook files.
Interestingly enough, the spike at the 70 is smaller than other spikes. Maybe because a low percentage of first downs go for exactly 10 yards, so, starting at your own 20, you would rarely expect to find yourself at your own 30 on the same drive.
Also, I'm not sure I buy your 11-yard-line theory. I actually think it's due to official scorers' biases, that any spot between the 10.01-yard-line and the 11.99-yard-line will be marked as being at the 11-yard-line.
For example, if the ball is spotted on your own 29.5-yard-line, it will probably be listed in the play-by-play as being at the 30. No big deal. But at your opponent's 10.5-yard-line, if the scorer lists it at the 10, that would incorrectly imply that it's a first-and-goal situation when it's not, because a first down would occur before the end zone. So, official scorers will mark it at the 11 so that first-and-10 makes sense in the game logs.
yeah that's really interesting
I've alway thought that with ambigous plays near the goal line that ref are overly reluctant to spot the ball at the one as oppose to giving the TD, which would make sense given the spike at the one
my guess is that they're also somewhat reluctant to spot the ball at the ten rather than the 11, because a 1st down can't be got from the 10, where as in theory with a 1st and 10 from the 11 you have 6-8 potential shots at the endzone (depending on your desire of going for it on 4th downs)
I don' know, but I'd bed donuts to dollars that the point expectancy of a 1st and 10 from the 11, 12, or 13, is significantly higher than a 1st and goal from the 10
The only thing I can think of is that some players fall down or 'give up' when they get close to the lines instead of going all out for that extra yard. Could be a mindset where running backs know they need so many yards to get the first down so they eyeball the line just past where they need to go. Receivers maybe use the lines as landmarks for their routes when they catch the ball and in some cases are immediately tackled.
Then, like you said, the refs put the ball on the line.
By eyeballing, it appears these peaks are about 20% more than the best fit line. Do you have the data to figure out what percentage of catches have zero yards-after-catch? Is it close to 20%? I can't think of anything to get the equivalent numbers for RBs.
that kind of freaks me out. and not in a math way.
It is interesting, but it may be an artifact of how the data is recorded. In reality, the field is continuous, so every field position in the drive chart is rounded to the closest yard. The field it self is marked in five yard increments, with two sets of "hash marks" to indicate the yards between the 5 yard markers. These two conditions can lead to observer (or reporter) bias. For example, let us assume that the ball is really on the 40.6 yard line, how many are reported as the 41 yard line and how many as the 40? There also seems to be a slight up ticks around the X2.5 yard lines, which would occur if the bias is towards the closet x5 yard line (more x5's reported and less x4's and x6's, and more x0 reports and less x1's and x9's.
I believe that Phil(above) is also correct that there is a bias around the 10 yard line, and 10.1 yards are reported as 11 yards.
I agree with Phil's take about the 10.
I think the rules on how the ball position is recorded is defined by the yards gained/lost from the previous spot. And that is determined by "how many hash marks did the ball travel across." So the only time there is any discretion is on a punt out of bounds.
I guess the next step is to see if there is enough examples of that to account for the extra frequency on the 5s and 10s. But there is also the cascade effect due to penalties too.
I notice that 60 has fairly high bump, as well, which is probably due to out-of-bounds kick-offs.
I wonder if this is recalculated, throwing out snaps that occur immediately after kickoffs/punts how much that would diminish the spikes at the multiple-of-5-yard lines. Throwing those out would remove the bias for out-of-bound kicks, and should also greatly reduce the spikes at 80 and 60.
JJB-Great idea. It would take a bit of coding on the database, but that would do it.
Could it just be that whoever is scoring the game tends to have a bit of a bias towards an even number?
That is, suppose the ball is spotted at the 36.5. That might be recorded as the 37, or maybe the 36.
But if the ball is at the 39.5, maybe it gets rounded up to 40 just unconsciously?
Actually, looking closer, the spikes are about 10% higher than you'd expect. And the ball will be exactly at a yardage ending in 9.5 or 0.5 yard line about 20% of the time they'd round to the something-0. So if whoever's keeping score rounds to the zero 100% of the time, instead of the 50% of the time that you'd expect, that would explain it exactly.
suppose like phil said, the ball is spotted at the 39.5, or 40.5
If phil is right, and it is due to whoever is scoring the game then doesnt that mean there should be negative spikes at the 39 and 41 in order to make up for the number of times it was spotted at the 40
I'd buy what Phil says, but I don't think the scorers have any discretion in the rounding. I think the rules are *really* firm. The scorer's gamebooks get audited every game, and everything has to add up perfectly--no rounding allowed.
I'm not sure the exact rule, but it's something like: if the nose of the ball is at all pastthe 25, that's the 25 yd line no matter how close the ball is to the 26. If the nose of the ball touches the 26th hash mark, then it's the 26 yard line.
Maybe it's something I can look up.
The full yard notation in gamebooks can lead to some bizarre situations near the goal line. If a team makes a first down at the 10 yard and 1 foot line, that's first and 10 from the 11. If they make 9 yards and 2 feet on first down, that's "second and 1 from the 2"... despite the ball being on the 2 foot line.
I was wondering with a friend this weekend: How far off are we from simply having some kind of tracking/GPS system tell us the exact field coordinates of the ball at all times? We certainly have the technology and it's not as if the NFL doesn't have the money.
No more ambiguity about ball spotting, no more of this ridiculous "bring out the chains" pretense of precision when it is clearly an inaccurate system (ever notice how funny these giant orange arrows look when flanked by a ref?), no more wasting 15 minutes of my life to challenge whether or not a ball "crossed the plane". All of this would be systematic and unassailable. Why don't we have this already? What gives?
...I agree with everyone else, this strange graph is likely due to referee bias in spotting the ball.
Knowing the physical position of the ball is only part of the picture, though-- the refs are spotting the ball at the moment in time when it is downed.
It would be helpful for a few circumstances, but ball-spotting is going to be open to judgement calls no matter how much tech is involved.
great stuff Brian! very interesting.
Could the spikes be due to round off in the gamebook, as opposed to the actual spot of the ball on the field? That would be my guess.
--bob
just read the other comments, i guess round off error is not the problem. I might think it still is though. Does this bias show up in a single game? What is the actual
Um, how bout
-bob
PS I'd suggest making a histogram of every parameter you have data on. Who knows what you would find.
wow, i flipped up to look at the graph, and this page barfed on my comment. sorry.
-bob