
 One neat thing we can do with a win probability model is identify a 'play of the week.' I realize its an old and overdone concept (I feel like I should get Old Spice to sponsor it), but now we really can point to the truly most important play among the several hundred each week of the season.
In week 7, the official Advanced NFL Stats play of the week came late in the Charger-Bills game. With Buffalo ahead 20-14 with 6:16 left in the 4th quarter, the San Diego offense drove deep into Bills territory. With a 1st down and goal from the Bills' 9 yard line, the Chargers actually had the upper hand with a WP of 0.60. Phillip Rivers dropped back and threw directly into the hands of Bills defender Kawika Mitchell who returned the ball 34 yards.
As a result, the Chargers dropped to a 0.14 WP, a catastrophic fall of 0.46. The Bills went on to put together a field goal drive that essentially put the game out of reach. Congratulations Kawika, you've won a lifetime premium membership to Advanced NFL Stats!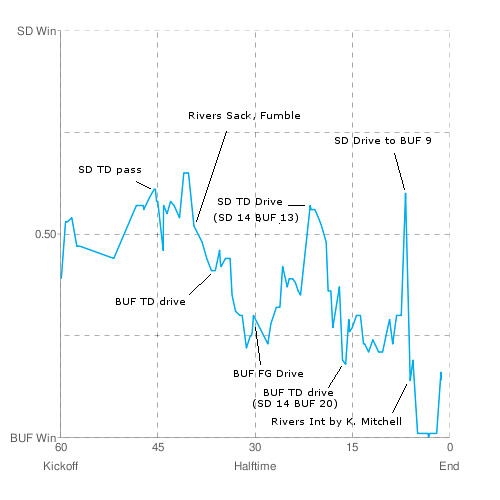
Play of the Week
published on 10/20/2008


Subscribe to:
Post Comments (Atom)
The only problem I see with looking at abs(delta WP) is that it's going to give a lot more weight to plays towards the end of a game, rather than being a measure of how skillful the play was as and of itself.
Out of interest, do you have a number for how Janikowski's 57 yarder affected WP, or is that too badly specified due to the small number statistics for that kind of thing and the non-trivial possibility of a tie by that stage of OT?
"The only problem I see with looking at abs(delta WP) is that it's going to give a lot more weight to plays towards the end of a game"
So? Investment bankers put a lot more value on a dollar today instead of a dollar next year. Time matters.
Anyway, this is wildly awesome. I notice you have more guide lines as I suggested. Thanks! That does help a lot.
jorallan-I definitely agree. That will be the case particularly in close games. But that's kind of the point.
Dr. O-Thanks for the suggestion!
Re Janikowski's 57 yarder: Good question. I'm not sure because I don't have a good model for sudden-death yet. It requires its own system because any score will end the game. For now, I just fudge it and artificially keep the time remaining as if it were 2:00 in the 4th qtr. It's kind of like every drive could be the last one, but I know that's not really a good solution.
Possession itself is worth a lot. So Oak having the ball at the 40 by itself would have given them at least a 67/33 or 75/25 advantage. I'd guess the kick itself would therefore be a +33 or +25 event.
But had he missed it, the WP would have swung for the Jets, at about a 60/40 advantage. So the potential or leverage (as the baseball guys call it) would have been huge.
Maybe that's the better way to think of a 'play of the week.'
Great idea! Keep it up!
Great feature. The DAL-STL game was almost flat-lined for the entire second half, moreso than TEN-KC and DEN-NE.
Have you gone back in time to apply the in-game WP to past play-by-play databases?
Not yet. It just works in real time for now. I'm sure I'll get around to that at some point.
the potential or leverage (as the baseball guys call it) would have been huge.
Maybe that's the better way to think of a 'play of the week.'
In principle I agree, but it's only in a few cases, like a field goal attempt or 4th-and-goal play, where the alternative situation the result is leveraged against is (fairly) clear. To take the Kawika Mitchell play as an example, what's the alternative?
I love the idea behind this feature. Keep it up.
What is the spike immediately preceding the 1st-and-9 play? Looking at the play-by-play for this game, I don't see any big plays that would warrant such a large spike in WP.
Jim A- Although it looks like a single spike from a single play, it's actually 3 or 4 plays. A single play would look almost purely vertical.
The Chargers went from their own 42 to the BUF 9 pretty quickly. The big spike, the little shelf, and the the little spike before it comprise their drive. A single play accounts for a good part of it though. Gates caught a 19 yd pass to put the ball on the Bills'42.
But you have pointed out a small flaw in my system. It polls the live game states every 30 sec, so there are some rare occasions when 2 plays may be interpreted by the graph in a single update. But the live update feed can cause even more problems. If you've ever watched nfl.com's gamecenter or similar live feeds, the updates can sometimes be irregular. In fact, if you look at the 1st qtr of this game, there was an entire chunk missing due to a power outage at the stadium.
Excellent stuff. A very nice analysis.
-bob
I think the real problem is that 60% WP is too high for this situation. Consider that the expected points value at the opponents' 9 yard line is a little more than 5 points, according to your own chart. So without checking the actual probability distribution, a reasonable estimate of the possible outcomes of this drive is likely something like this:
P(TD) = .70
P(made FG) = .20
P(missed FG or turnover) = .10
Even in the TD case, it's only a 1 point lead, and remember that the kickoff return will give roughly half a point in expected value to the receiving team. So even the best case for SD, 60% seems like a stretch.
A FG still puts SD down by 3 points on defense. Your previous WP graph suggests that a team trailing by 3 with 5:00 remaining is about 30%.
A turnover gives Buffalo the ball with a 6 point lead. Here, your graph suggests that's about 20% for San Diego.
So add them up and you get (.70 * .60) + (.20 * .30) + (.10 * .20) = .50
As I mentioned above, I think this estimate might even be a little high. But unless I'm missing something, 60% doesn't seem plausible to me at all.
Jim A- Good observation, and I think your analysis is reasonable. All I can tell you is that yes, 60% is about right based on the past 8 years of games--well over 2000 of them. When trailing by 6 (which is relatively common), teams with the ball on (or near the 10) won this often, listed by minutes left in the 4th qtr:
Min WP
----------
0-1 0.53
1-2 0.61
2-3 0.43
3-4 0.59
4-5 0.57
5-6 0.62
6-7 0.61
7-8 0.58
8-9 0.53
10-11 0.46
No fancy modeling here. The sample sizes are very large, so the system just relies on history (with some smoothing). It might not be exactly .6, but it's going to be very close. That said, there is noise in all data and these WPs are always just estimates.
One thing to consider is that if SD failed on a 4th down attempt or turned the ball over (without a huge return), BUF's field position would be terrible. So even if SD doesn't score on that possession, things wouldn't be so bad for SD.
What cost SD was that they didn't use any time on the clock, and that BUF had an uncommonly long return after the INT.
In my little table above notice how the WP goes up, then down, then up again as time remaining changes. One reason that WP was so high for SD, was because there was about 6-7 min remaining. This means that they will usually end up with one more possession than BUF due to the rhythm of the game. They'd have enough time to complete the current drive, and probably score. Then after a BUF drive, there's only time for 1 drive left, which would go to SD. It doesn't always happen that way, but it usually would.
Further, one reason why SD's .20 may be so low is that the turnover inverted that rhythm in an instant. Now, BUF would likely get the "extra" possession.
That's one of the big reasons why I'm basing the system on empirical data, and not doing much modeling (such as the probability calculations you did above).
Do you buy any of that? Don't get me wrong--I'm not claiming my system is perfect. But that's why I think the numbers came out the way they did.
Hmmm. The more I look at this, the more I agree with your point. I'm going to have to investigate further. I still think the 'rhythm' explanation makes some sense, but there is a conflict in the data.
If SD had scored a TD, BUF would have had the ball at their own 27 (on avg) after a kick off. With about 6 or 7 min left, that would have given them a slightly better than .5 prob of winning. That doesn't make sense with SD having a .6 prob with a 1st and goal at the 9.
The reality is probably somewhere in between.
I'm guessing the Favre INT returned for a TD is going to rank pretty high on the play of the week. Intuitively, that turned the game around pretty significantly, although the Jets came back to win (without any one big play).
Yes, that was huge play, especially for as early as it happened. My graph for that game is a little confusing, so I need to comb through the play-by-play to really tell. It looks like the DAL stop on TB's final drive might be the runner-up.