
 In the last post, I discussed how the Poisson distribution can model scoring in hockey (and other sports such as soccer and lacrosse). I looked at how we can estimate a team's "true" expected winning percentage based on their average goals scored and allowed.
In this post, I'll illustrate how the same method can estimate the probability of which team will win a particular game. I'll also calculate the probability of which team would win a best-of-7 series.
Let's say the Washington Capitals are playing the Boston Bruins. The Bruins score 3.3 goals per game and allow 2.2, while the Caps score 3.1 goals per game and allow 2.8. (Actually, those are goals per 60 minutes of regulation play. I exclude OT goals and shoot-out goals.)
The Bruins' goal distributions look like this (from the last post):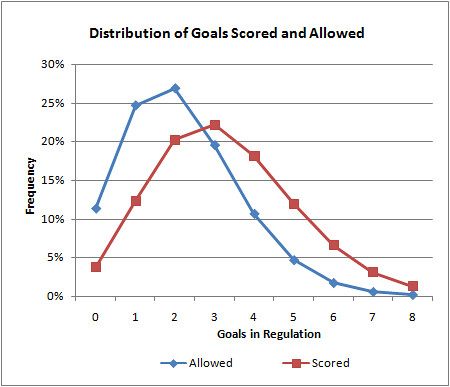
And the Caps' goal distributions look like this: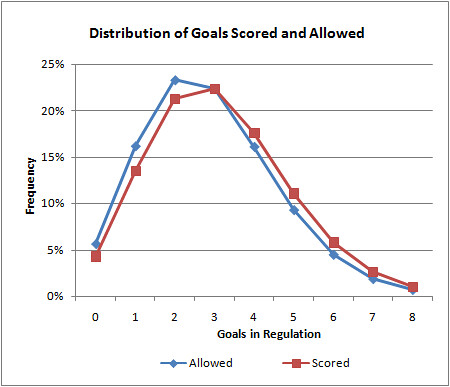
The Bruins are clearly the better of the two teams. Their goal distribution is skewed higher than their goals allowed. The Caps' distributions are closer together.
The average goals per game in the NHL is 2.8. When the Caps' 3.1 G/gm offense goes up against the Bruin's 2.2 G/gm defense, we could expect the Caps to score 2.5 G/gm. I look at it this way: 2.2 G/gm is 0.6 G/gm less than average for a defense. The Caps would therefore score 0.6 G/gm less than they usually do.
And because the Caps allow the league-average number of goals per game (2.8), we could expect the Bruins to score their season-long average of 3.3 G/gm. Now we have baseline expected scoring rates for each team in this particular match-up. The resulting Poisson distributions look like this:
Like I did in the last post, we can add up the probabilities of each possible goal combination. All of the permutations in which the Bruins win add up to 54.7%, and all the permutations in which the Capitals win add up to 29.2%. They'd tie in about 16% of the games, so if we split those games evenly, we get a 62.7% chance that the Bruins would win.
But this doesn't account for home ice advantage (HIA). In the NHL, the team with home ice wins about 55.4% of the time. Using a logistic adjustment (that is described in detail here), we can translate HIA into a logit value of 0.094. The Bruins' 62.7% win probability translates into a logit value of 0.520. Add them together if the game is at Boston, subtract the HIA logit from the game probability logit if the game is at Washington. Assuming the game is at Washington, we get a net logit of 0.426, which translates into a win probability of 62.7% for the Bruins. If the game were at Boston, it would be a 64.9% win probability for the Bruins.
At this point in the NHL season, the top playoff spots are already claimed. So many fans are more interested in how a best-of-7 playoff series would turn out. Given the Poisson model game probabilities, the Bruins would have a 76.1% chance of winning a playoff series vs. the Capitals.
Rather than post NHL game probabilities and series probabilities for the next few months (I'm not that interested in hockey), I've made my Excel spreadsheet available for anyone who's interested. I made a handy little interface with 2 drop down menus to select which teams you're interested in. It will calculate team expected winning percentages, game probabilities, and series probabilities.
Note that this model does not consider the end of game situations in which a trailing team pulls its goalie in favor of an additional skater. I would suspect this causes a slight amplification of goals scored for good teams, and goals allowed for poor teams. It would make ties slightly more likely than the model would expect, and it would make 2-goal victories slightly more common and 1-goal victories slightly less common than expected.
I'll repeat my disclaimer from part 1 of this post. I doubt much of what I've done here is original at all. In fact, in the past couple days I found a few hockey stats sites which I'm certain cover Poisson modeling and much more.
Comparitive Modeling: Hockey as a Poisson Process 2
published on 3/12/2009


Subscribe to:
Post Comments (Atom)
Where did you get the raw data for the table on the second sheet? Those data change after every game, and it would be nice to be able to keep that up to date without typing in all that info by hand.
From the NHL.com stats page, goals by period.
Great stuff Brian. Thank you very much for making the excel document public. It is a very unselfish way to teach others and help other "analysts" out. Just from seeing the spreadsheet I have a better understanding of how it was done.
Justin: I took a look to see if the stats could be queried into excel automatically and it doesn't look like it. There is a feature in excel called import new web query, but the nhl.com stats page isn't reading in table format and therefore won't work.
Jay, hopefully you're subscribed to the post comments.
I discovered rather haphazardly that if you go to the stats page Brian mentioned and hit the Print button, it'll give you a table. Sorting still works there, so you can sort by team, and then just copy the entire deal into a text file. It's then tab delimited. You can just copy the contents of that text file into cell A1 of the second sheet of hockey-poisson.xls.
It's not as nice as a web query, but it's a whole lot better than inputting it all by hand!
I just sort by team on the web page, then select the table by left clicking and dragging the mouse. Right click|Copy. In Excel, I just right click on the upper left cell of where I want the table to go and choose 'paste special'...'text.'
Good news Justin:
When you view it in the print format, it can be used as a web query. Doing it through a web query will make it so that when you refresh the sheet, all the new data will show up.
So for example, using the web query would allow you to just open up the excel document and then hit refresh, which will grab the most up to date data on the nhl.com stats section.
Hi Brian..great work as always...and I'd also like to thank you for posting spreadsheet .
**(Alan Ryder of Hockey Analytics was the first I read who identified Hockey scoring as poisson
(links)
hockeyanalytics.com/Research_files/Poisson_Toolbox.pdf
One question I have my own Gf and Ga adjusted numbers for teams based on more accurate stats and I have probabilities
using poisson. However, to adjust for Home ice
I have just been adding the league average not great?
But could you quickly explain the formula/method you use for converting neutral probabilites to logit using your example:
Boston is 62.7 % Neutral logit .52
How do you get this?
With My numbers Vancouver is 60% neutral what would
the conversion to logit value be ?
I need this because I have all my own GF and GA numbers for each team so I can't just use your great spreadsheet.
thanks
Dan
Hi Brian; One more thing.
I would appreicate your view on the way I do Home ice advantage.
League total 2008/2009 home teams scored .335 more goals than away teams (3710 to 3296)
then I add 1/2 of this to home teams expected G/g (~.168)
and subtract (~.168) from away teams expected G/g
In your example this would be Boston 3.46
and Washington 2.34
what mistake am I making?
thanks Dan
Hi Brian..
I didn't realize you included your worksheet
from excel?!..I have the formula I need for Logit..thanks
Dan
Bruins -300 against the Caps to win a best of 7 series. Do you account for any of the statistics these teams accumulated head to head?
I'll take the under on -300 as the opening line for up to 10k.
the link for the hockey-poisson.xls spreadsheet no longer works, can it be fixed?
apparently not, emailed brian twice but no reply and no reply here. can anyone email it to me at junkmail1 at cogeco.ca ? thanks
Dear Brian,
interesting your poisson, how to find your file hockey-poisson?
I see that it's not function to download.
I hope that you can to pubblish again the file.
Thanks
Davide