
 One of the more popular articles here over the past year or so has been the 'Myth of 370' article that debunked the direct connection between very high carries one season and significant decline the following season. Atlanta running back Michael Turner is at the center of the discussion this year, at least in terms of fantasy production. He had 376 carries in a breakout season, so naturally fans are wondering what to expect from him in 2009.
Judging by some of the discussion out there, I'm worried some people misunderstand what the Myth of 370 article says. What it does not say is that Michael Turner can be counted on this year to match his 17 TDs and 106 yds per game from 2008. In fact, history suggests he won't repeat. What the article does say is that a RB's tendency to decline after a career year is not due to overuse the previous year.
For a RB to have a career year, a lot of things come together all at once. By definition, he's healthy himself. Plus, he's usually at his peak athletically, he has a talented and healthy offensive line, and his opponents tend to be weak at defending the run. Should we expect the stars to align the same way in following year?
Of course not. Linemen come and go or get hurt, opponents change, and lots of other factors change. Chances are most of those factors aren't going to get better, but get worse. This natural process is at the heart of the concept of regression to the mean. To see what I mean, look at the two following graphs based on top RB performances from 2001 through 2008.
The first graph plots RB rushing TDs per game from one year vs. his rushing TDs per game from the following year. A regression line is fit to the data, showing us what we can typically expect from one year to the next. For example, Michael Turner's 1.1 TDs/G from 2008 would typically suggest a 0.8 TD/G output in 2009.
The same effect is present in rushing yards. Turner's 106 Yds/G from 2008 can be expected to tend towards about 85 Yds/G in 2009.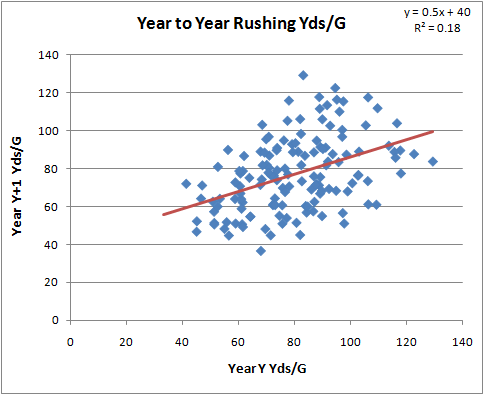
These graphs are presented in terms of 'per game.' Total production is therefore heavily dependent on how many games a player appears in. The top RBs from one year (regardless of the number of carries) tend to play in only 13 out of 16 games the following year. This should also temper anyone's enthusiasm for a repeat year from Michael Turner.
However...these regression effects apply to all RBs, not just Turner. So you shouldn't avoid Turner any more or less than any other top RB in your fantasy draft. Plus, the regression only explains a fraction of the following year's performance. Turner could score 30 TDs or he could score zero. It's all a crap shoot, and I'm only discussing tendencies.
More on regression to the mean and: wide receivers / coaches / turnovers.
Michael Turner in 2009
published on 7/20/2009


Subscribe to:
Post Comments (Atom)
Brian. Is there an age curve for runningbacks similar to the age curve for hitters in baseball? In general, batters peak around 27. I'm assuming that RBs peak much earlier, so my quetion may be moot and they may be starting on a downhill path as soon as they turn pro anyways.
http://www.pro-football-reference.com/blog/?p=66
http://bleacherreport.com/articles/215283-nfl-aging-curves-by-position-rookie-qbs-third-year-wrs-and-age-30-rbs
http://www.feinsports.com/wp-content/uploads/2009/07/aging-curve-rb.bmp
Looks like you're right about decline from the get-go for RBs, at least in terms of YPC.
Two of the interesting things about regression to the mean are that it's incredibly trustworthy, on average, but that it's based on unconditional analysis: we're just looking at yards in one season and yards the next.
This has the nice benefit of showing up well on a graph. It has the sadness of making very little use of these incredibly high-powered machines upon which we all type.
I imagine (and for perhaps obvious reasons) that the single best predictor of YPC is...lagged YPC. But as you very helpfully note on your graphs, the R^2 is only ~.2.
I have to guess that you've screwed around with other regressors. Anything noteworthy in terms of raising the R^2? I don't mean overfitting on free parameters, but maybe doing a sample for calibration and a sample for prediction, as you did with your WP function analysis.
Thanks, by the way, these are really interesting.