
 Occasionally I see comments asking about the win probability model's accuracy. The model and the game graphs it creates are useful and entertaining, but only if they're accurate. How do you know I'm not just making up a bunch of nonsense?
For readers who are accustomed to linear regression models, you'd expect to see a goodness-of-fit statistic known as r-squared. And for those familiar with logistic models, you'd expect to see some other measure, such as the percent of cases predicted correctly. But the win probability model I've built is a complex custom-built model, using multiple smoothing and estimation methods. There isn't a handy goodness-of-fit statistic to cite.
We can still test how accurate the model is by measuring the proportion of observations that correctly favor the ultimate winner. For example, if model says the home team has a 0.80 WP, and they go on to win, then the model would be "correct."
But it's not that simple. I don't want the model to be correct 100% of the time when it says a team has a 0.80 WP. I want it to be wrong sometimes. Specifically, in this case I'd want it to be wrong 20% of the time. If so, that's a good feature of any probability model. This is what's known as model calibration.
The graph below illustrates my WP model's calibration. The blue line is what would be the ideal calibration, and the red line is the actual. As you can see, it's nearly perfect. Whenever the model says a team as a 0.25 WP, it goes on to win 25% of the time. And when it says a team has a 0.35 WP, it goes on to win 35% of the time, and so on.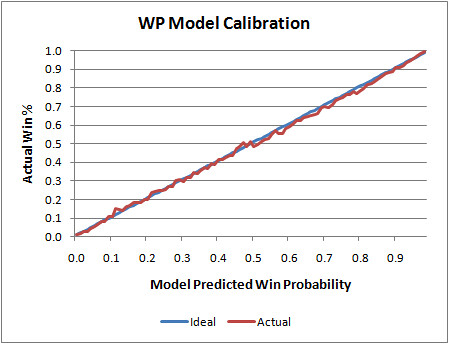
That graph is slightly deceptive, however. The model is essentially "predicting the past." In other words, it's using the same game data it was originally built on to test itself. (There is so much data in the sample, I doubt this is really an issue.) Actually, the model is based on data from the 2000 through 2007 seasons. So here is the model applied to the 2008 season, which was not included in the 'training data.'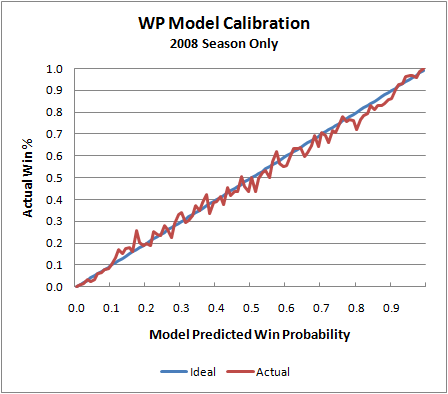
We see the same tight symmetry, which is what we're looking for. Of course, there is naturally more noise because of the smaller sample, but that's completely expected. I do notice that the actual values 'sag' a little toward the upper end of the scale. This may suggest that the model is very slightly (but possibly systematically) undervaluing possession when teams have large leads early in a game or small leads late in a game. That's something worth investigating.
But calibration is only half the story. Consider a WP model that always said each opponent had a 0.50 WP no matter what the score was. Technically, it would be perfectly calibrated. It would end up being correct exactly 50% of the time. So aside from calibration, we'd want a model to be confident. If a model possessed God-like omniscience, it would have 100% confidence as soon as kickoff. Obviously, we can't do that (even for games against the Lions). But as long as the calibration is sound, the higher the model's confidence the better.
Here is a plot of the WP model's confidence by game minutes left. At kickoff, it's a 50/50 proposition, and then as the game unfolds it becomes clearer who has the upper hand. Even in the final minute, it's not totally clear which team will win, and that's part of what's great about the NFL.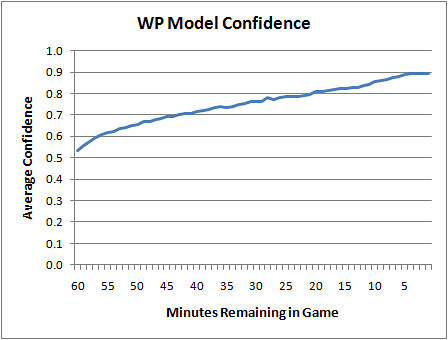
Needless to say, I'm very pleased with these results. But this isn't a testament to clever modeling or brilliant research. It's simply due to the wealth of data I started with. Even so, I'm currently working on major improvements that I hope will be ready for the upcoming season.
Win Probability Model Accuracy
published on 7/07/2009


Subscribe to:
Post Comments (Atom)
With regard to improving general accuracy, would you look to add in some form of adjustment to take account of home-field advantage?
I suppose with that one major issue is how you fade out home field advantage and bring in game situation (i.e. at the start of the game, the home team wins more often than away teams, but if the scores are tied at the start of the fourth quarter we'd expect somewhere closer to 50-50, although home teams probably slightly ahead)
So in the Broncos 39-38 win over the chargers last year, your model has the chargers winning that game 99% of the time at one point. Did the Broncos really only have a 1% chance there?
Ian-True. If I add in a HFA adjustment, even one done badly, the confidence levels will improve.
81-Probably not. The model's achilles heal currently is 4th down decisions late in games. It has a hard time telling when teams will actually go for it. The WPs can be drastically different if a team kicks or goes for it. In that case, DEN went for it and won.
Brian,have you tried to running a WP calibration using an atypical group of games,for example a group where there is a very strong home favourite.
Your observed tight symmetry may be a reflection of the make up of the non training set very closely resembling the make up of the training set.
Systematic errors in these kind of data driven models usually become more evident when you apply them to extreme match ups.
Nice blog . i kept it as a bookmark. thanks a lots.
Hey - just came back to the site for the first time in the offseason. In our WP probability, we ran the exact same graphs as above with identical results. My one question - do you have any idea why the greatest diversion points are at ~20% and 80% ? We observed a similar phenomena....
-Mark Kamal (Protrade - mkamal@protrade.com )
Mark-Welcome back. No idea. I'm guessing we used similar data sets, so if there were quirks in the data they'd probably show up in any model.
"There isn't a handy goodness-of-fit statistic to cite."
Not true! Whatever statistic is of interest (accuracy, quadratic loss, AUC, etc.) could be estimated on hold-out data.