
 Reader Jeff Clarke sent me an email a few weeks ago asking about the interception yardage value used for the Adjusted Yards Per Attempt (AdjYPA) passing statistic. AdjYPA is total passing yards minus 45 yds for every interception thrown, divided by total attempts. It's a really handy stat because it encapsulates passing performance as a simple, single number, and better still, it's a rate stat.
The 45 yard adjustment number comes from the 1988 book Hidden Game of Football. The authors don't fully explain how they arrived at that figure, but I gather it was based on an analysis based on expected points. They do however, make a good intuitive case for it. An interception can always be thought of as costing any chance at a first down and precluding a punt. Punts net between 35 and 40 yds, and forfeiting a chance of the first down costs and extra few yards, which together comes to about 45 yds. Perfectly reasonable...for 1988.
Fast forward 21 years and the passing game, and offense in general, has become more potent. With offenses being more efficient, the value of having the ball is therefore greater, and turnovers would accordingly be more costly.
Jeff Clarke made a great observation. He wrote,"your own 15 yard line is the point of indifference. Holding everything else neutral, you are indifferent between having the ball at your own 15 and your opponent having it at his 15. Doesn’t this mean that the penalty for throwing an interception on first down should be 70 yards – the distance between the 15s?" (Expected Point curve below).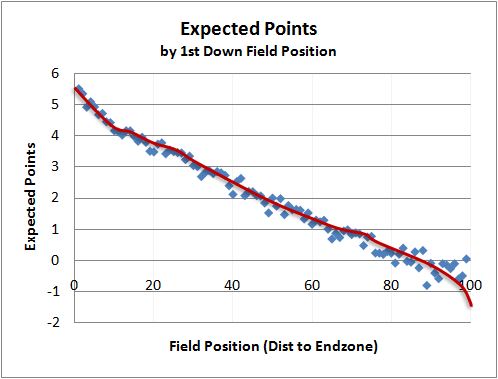
Jeff went on to point out that the cost of an interception would be less on 3rd and 15 than say, 2nd and 1 because the expectation of a first down is different for each situation. Jeff's analysis predicts that the true yardage equivalent would be something shy of 70 yds--the distance between the 15 yd lines. I was convinced to dig a little deeper.
The average difference between interception plays and non-interception passes is 3.81 expected points. This is the weighted average for all plays on 1st, 2nd, and 3rd downs for all yard line. It accounts for return yards, and down & distance situation. I excluded 4th down passes, as those are often thrown in desperation situations, where high levels of risk are acceptable and the cost of the interception is not much different than a simple incomplete pass.
3.81 points equates to approximately 60 yards of field position. The graph below plots it nicely. The green line is the EP for non-interception plays, and the blue line is fit to the EP following interception plays.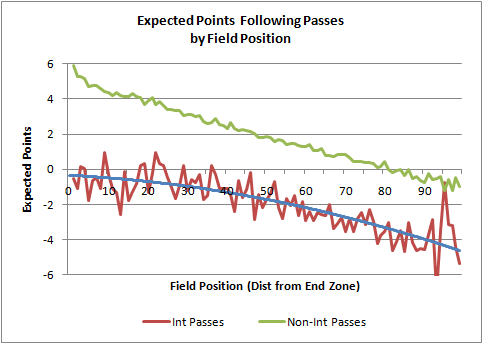
EP is roughly linear away from the end zones. So if we look at the expected points graph for non-interception plays (the green line), +3.8 EP is at the opponent's 20 yd line. And the 0 EP point intersects at a team's own 20 (80 yds from the end zone on my graph). That's a difference of 60 yds.
60 passing yards is the modern interception equivalent of an interception, not 45.
Adjusting Adjusted Yards Per Attempt
published on 9/09/2009


Subscribe to:
Post Comments (Atom)
Brian, does that include the distance the pass traveled and was returned? Couldn't it be that the net "gain" infield position on the interception play is 15 yards, which is what brings it down to 45?
Okay, 15 does sound a bit high. But you know what I mean.
Yes. In my data the avg int return comes to within 8 yds of the original line of scrimmage (8 yds to the defense's side.) But elsewhere (footballcommentary.com I think) I've read that the average is closer to the original LOS.
PS. My post tomorrow has more details on that issue.
OK, thanks! So the 60 yards is really 68 yards, minus 8 for field position. That's almost exactly from the 15 to the 15, as predicted.
So if you are backed up to your own 5-yard line, the best strategy is to intentionally throw an interception? (Just reading the second graph carefully here)
This is great, and very important. (And fascinating.) Increasing the the value of an interception from 45 to 60 (and I already think some teams underrated interceptions, or at least were wildly inconsistent with how they rated them) changes optimal strategy greatly.
Measure-There's some random noise in the data due to sample error. Backed up against one's own goal line is where the data is the thinnest (it just isn't as frequent as having the ball elsewhere on the field). The blue estimated line is what we should focus on.
Phil-Yes. The 60 yards already factors the yardage delta on the play. Let me get a little more specific on my exact methodology.
I have this giant list of every play from the past 9 seasons. I've given each play has a 'next score' value. If the team with the ball goes on to score a TD before the other team scores, the 'next score' is +7 for that play. If they score a FG it's +3. If the other team scores next it might be -3, or -7, or -2...and so on. If time expires it would be zero.
1. If I average all the next-scores and break them out by field position, I get an expected point curve for all types of plays. When I limit the data to only 1st downs, I get exactly the top graph in the post. (With one twist--you have to subtract out 0.6 EP for the value of a kickoff after each score.)
2. I limited the data to all passes on 1st, 2nd, and 3rd downs. And then I broke it out between passes that were intercepted and passes that were not intercepted. Now I have 2 EP curves, the green one and the red/blue one on the second graph.
3. I calculated the weighted average of the difference in EP between the non-intercepted and the intercepted curves. (Weighted according to the number of intercepted passes at each field position.) The average difference was 3.8 EP.
4. Looking at the green curve (the weighted EP for non-interceptions), 3.8 EP is equivalent to 60 yards.
5. EP already takes into account the gain or loss on every play, including the yardage delta on an interception. Had int returns typically gone say 25 yds past the original LOS, the resulting EP for ints would be much lower (for the throwing team). Had int returns averaged say 25 yds deep (like a short punt), the EP would be accordingly higher.
So I didn't compute the effect of the int and then tack on 8 yds. The method already naturally accounts for the full result of the play. I should also note that this is the difference between an int and any pass, completed or not. If you compared ints to just incomplete passes, you'd get a lesser yardage equivalent.
Hi Brian - Have you done a similar analysis with fumbles? Dave Berri's football analysis takes away 50 yards equivalent for any turnover; it would be interesting if his number and your numbers converge when you add in the cost and frequency of fumbling.
Although my previous comment was kind of pithy, and I see where I went wrong, I would like to mention something I've been thinking about when it comes to interceptions.
An interception on a short pass is far more devastating from my view than an interception on a long pass.
A long pass intercepted doesn't seem that different than a punt to me. Just a different down situation leading to it.
No. Nothing on fumbles yet.
But 50 yds might be the right answer, depending on what you compare interceptions to. If you compare an interception to any other pass (complete or incomplete), it's worth 60 yds. But if you compare it to an incomplete pass (because an incompletion is already already factored into the Yds Per Att stat), you get 50 yds. The EP difference would be 3.2, which equates to 50 yds instead of 60.
In the ends, it depends on what you're comparing the interception to, and what the goal of the analysis is. You could also compare it to any play, not just passing plays, and you'd get another, different answer.
It would be interesting, as referenced in the article, to know the difference between an INT on 1st down, and on 3rd down. I know one never prefers an INT, but a 40 yard pass on 3rd and 12, when intercepted, doesn't really change the outcome a lot. I don't think it's a negative 60 or 50 play.
I think INTs are huge plays, but I'd encourage my QB to take a risk when it's already 3rd and long, as opposed to making a safe play.
A thought provoking post, as always, Brian. I have a few thoughts.
One thing to consider about "passing games being more potent." The value of having the ball may be greater, but if we're comparing the cost of an INT to the cost of a punt, that might actually reduce the value of an INT. The better teams get at driving down the field, the less important starting field position becomes. Cutting the other way, I think punting averages have increased since '88.
Re: Jeff's point -- the penalty for throwing an INT on 1st down must still be under 70 yards. Why? Because we're comparing the value of an INT with the value of an incompletion. The alternative to an INT on 1st down is 2nd and (usually) 10. Which is less valuable than 1st and 10. Note that INTs already go down as incompletions, which is why we're only looking at the difference between an INT and an incomplete pass.
On to your analysis. For starters, I think it's unfair to exclude 4th down INTs because they're thrown in desperation. Why? Because a non-zero number of INTs are thrown in those situations. If you want to talk about the value of a median INT, that's fine; but if you're looking for a weight to assign to all INTs thrown, you can't ignore that a number (and a largely disproportionate number) of INTs come in those 4th down situations.
Finally, I think you need to compare the value of an INT pass to not just the value of your average pass, but the value of your average incompletion. That's much different -- you need to exclude all TD passes and completions. If you consider a TD pass to be worth about 20 yards, then on average, a pass is worth about 6.75 net yards over the past few seasons. Do you include sacks in your "passing plays?" If you do not, then the average pass is worth about 7.75 yards. If you exclude passes that result in INTs (the non-INT pass), then the average would obviously increase a bit.
When you add in 4th down INTs, that might drop the yardage penalty closer to 55. And when you subtract out the average gain on pass plays (because incompletions gain zero yards), you'll end up very close to 45.
I think anywhere from 45 to 50 is appropriate. And at this time, it's worth reminding people that INTs are generally random events. So if you want to predict which passers will be good this year, you'll wnat to exclude that heavy INT penalty from past performances.
Sorry, Brian. I did not read the comments before posting.
I think you absolutely need to compare the value of an interception to the value of an incompletion. You need an INT penalty for ANY/A or AY/A because otherwise the formula doesn't know that INTs are bad. But the formula already knows you didn't gain any yards or throw for a TD on that play. It's just like when figuring out the value of a touchdown, you need to compare it to the value of getting stopped short on the one foot line.
You also have to be careful about putting this INT penalty back into the passer rating because much more so than TD rates, completion %, and yards per attempt, INT rates are fairly dependent on the current score (i.e. they are lowest with a big lead and highest with a big deficit).
So although this analysis argues for a higher penalty than 45 yards, I would argue that it actually should be lower than that because a disproportionate number of interceptions (even on a per attempt basis) occur when the passing team is trailing (and thus employing higher-risk strategies). In other words, since losing leads to higher INT rates, the penalty in terms of winning is lower than what you'd get by using expected points analysis.
Thank you for posting this. You covered a lot more ground since our initial emails. I tried calculating it a couple other ways. One was using Win Percentage on the theory Jim A posted that a disproportional number of interceptions might be coming in desperation situations and that hail mary ints have no real cost. These ints were balanced out by ints returned for touchdowns and ints deep in opp territory that cost the team significantly more than 60 yards. No matter how I calculated it, I got answers generally in the 60-65 yard average range.
Chase:
I see your point about comparing it to an incomplete pass. I guess which stat you use would depend on the circumstances you were using it for but I think it should generally be compared to no play at all.
I got to thinking about this topic while thinking about the whole subject of comparing quarterbacks with ratings, etc. and perhaps eventually coming up with a better rating system. Obviously, you need to give points for successes like completions, yards and TDs and subtract them for failures like incompletes and interceptions. Ultimately, you need to look at how much each failure cost you in EPs, yards, WPA or whatever.
As you point out, the cost of an incomplete pass isn't 0 yards. I haven't done any calculations on what an incomplete pass on first down costs a team in equivalent yards. We could calculate that though and say that an incompletion costs X yards. It seems like its easier to just say a first down interception costs 70 yards than to say it costs 70-x and then basically bill the QB separately for the x from the incompletion he would have thrown had the defender dropped the ball.
I think accounting for game state, down and distance, score, etc, is why I still think some sort of WPA stat or something derived from that could be viable to some extent.
I agree with alex in that adjusting for game state would be ideal for measuring QB performance. However it wouldn't necessarily be the best measure of QB skill (i.e. ability or true talent). It's the whole retrodictive vs. predictive thing, yet most fans don't see the distinction.
The problem with trying to equate an interception to yards is that an interception is a compound event. The mission of the defense is to take downs from the offense. The mission of hte offense is to make first downs (i.e., "NEW" downs). On an interception, the defense not only does its job and takes a down, but it creates a down for its own team. Thus, the impact is something more than can be measured in terms of yards as change of possession is not measured in yards. For that reason, any formula that attempts to equate an interception to a single yardage number is probably deeply misleading.