
 In a recent article I presented evidence that offenses should generally pass more often on first down. Accounting for both the potential gains and the potential risks of each type of play, passing tends to lead to a greater net point advantage than does running. The analysis was based on a concept known as Expected Points, which measures the average point advantage an offense can expect given a down-distance-field position situation.
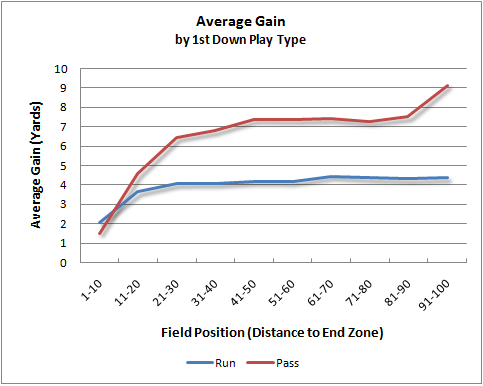
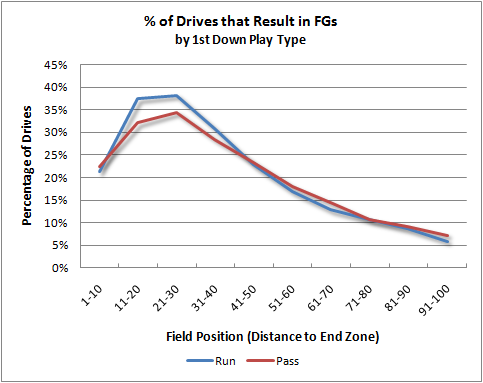
Expected Points incorporates all the various factors such as turnovers, yardage gains, sacks, incompletions, first down conversions, scoring, and so on. But I thought it would be helpful to dig deeper to investigate how and why passing appears more advantageous. In this article, I'll present a series of graphs comparing running and passing on first down, each one looking at a different facet of the game.
As in the original article, all data are restricted to what I call 'normal' football conditions, when time is not a factor and the score is relatively close. I looked at plays from the first and third quarters and when the score was within 10 points. This way, the effects of 'hurry-up' play and 'trash time' are excluded.
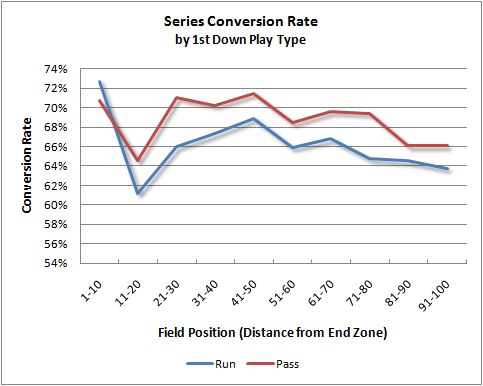
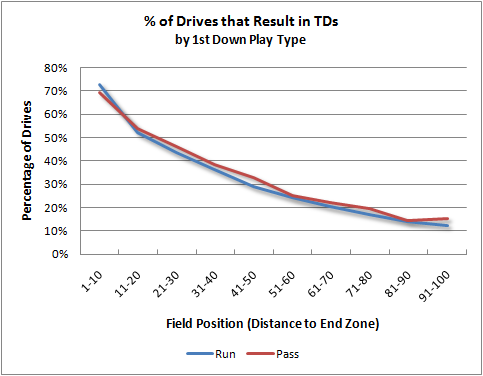
The first graph looks at series conversion rates. Generally, offenses that begin a series with a pass are more likely to convert than offenses that begin a series with a run. Note that this includes not only a conversion on the first down itself, but on subsequent plays on the series as well. Only inside the 10 yard line do runs tend to lead to conversions more often. Touchdowns are considered successful conversions. On all the graphs, be careful to note the scale on the vertical axis. Sometimes a small difference can look large, and vice-versa, due to the span of the scale.
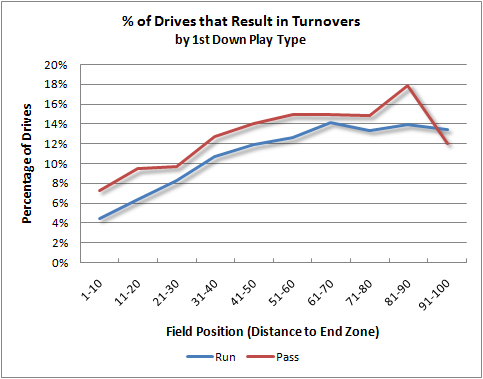
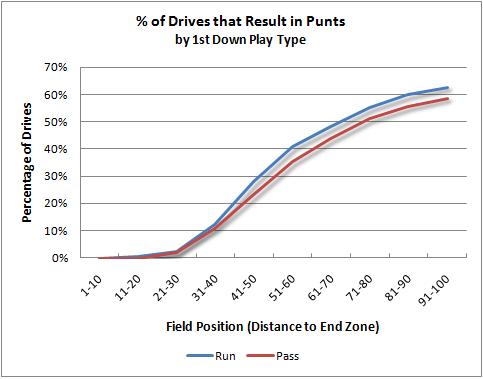
The graph below looks at turnovers. Passing plays lead to a higher risk of turnover than run plays on 1st down, whether due to interception or the sack-fumble.
As always, the usual caveats apply.


Quick comment on the last graph : Data might be biased by teams trailing, and going in pass-heavy mode.
These teams :
A - are sometimes going up against softer prevent defenses, boosting their success level
B - more likely to go for it on 4th down, so less likely to punt
Teh study only contains data Points from the 1st and 3rd quarter in close games, so these effects should not be existing in those data points.
PS: The more interesting question, is, if the study contains Selection bias due to the fact that the better offenses normally pass more often.
Yes, there's plenty of bias in both directions. Teams good at passing will pass more often, making passing look better. But teams good at running will run more often too, making running look better. I wouldn't rely on the pure exact numbers here, but the fact that passing is superior to running, and not the other way around, tells us a lot.
I assume this is your normal 8-9 years worth of data. I have heard a lot of comments by the 'analysts' that the NFL has changed to a passing league lately. I've seen some evidence showing there hasn't really been much of a change... but I bet these analysts would argue that passing is now more valuable over the last few years and is a more effective strategy partially because the defenses haven't adjusted.
Is this data showing that the pass is more beneficial on 1rst down consistent over the data set, or it is increasing over time, meaning that once running was more beneficial, and now passing is the better option?
Hi Brian - Just a suggestion. I think all the graphs, excepting maybe the average yards gained, would be more readable if you graphed the pass-run difference instead of the two values. This would get rid of your scaling issue.
Also, would you be able to make a graph of average or expected points for run versus pass across different field positions? Just eyeballing values from your graph, it looks like passing on first down from the 21-30 is worth 4.2ish points while running is worth 4.1ish (multiplying the probability of a FG or a TD by 3 or 7 and adding them together). Maybe going conservative is worth the small difference in points, given that you're 2% less likely to turn the ball over?
Alex, I believe the 2% turnover increase is already built into that EP calculation... although I do see what you are saying. It seems as though the NFL coaches are risk-averse and may even be aware that on average they should pass (or go for it on 4th down), but choose to minimize potential damage... ie coaching for the friendliest loss.
It makes sense though, if you remember the patriots-colts debacle of a few weeks ago. Many people would rather not risk winning or losing the game on 1 play, even though by the numbers it is correct... they would rather have multiple opportunities on defense to come up with a big play. Coaches/analysts often seem to have this risk-averse mentality. And of course analysts will mock you for whatever decision you made if you loose and applaud if you win, regardless of whether it was statistically correct.
Thanks Matt. I forgot the first article had the EP graph. Although it looks like it follows my example from these graphs - running versus passing preference becomes indifferent and switches to favoring the run closer to the endzone.
Great stuff, Brian. Makes a very strong case.
Do you think it would be worth looking at the pass/run EP gap at the individual team level? Or perhaps by groups of teams, based on size of the gap? Might be interesting.
I think you really, really need to plot the percentage difference between run/pass rather than the absolutes. You can't really make out anything for the cases where there's a huge change over the field (TD% and FG%).
(Error bars would be nice too, but that's just me dreaming.)