

The Redskins had several players at the top or near the top of the regular season +WPA rankings for defensive positions, Hall being one of them. But as I mentioned when I introduced defensive +WPA for individual defenders, gamblers--guys who roll the dice to make a play rather than adhere to their responsibilities--are most likely to be rewarded disproportionately. The problem is that +WPA doesn't capture all the instances when a gamble goes bad, only the times when it works out.
We can't (currently) measure a defender's -WPA, the degree to which a his failures affect game outcomes, because play-by-play descriptions never say things like "DeAngelo Hall bit hard on a double-move, Andre Johnson 67-yard reception for a touchdown." So although we can't attribute defensive failures to individual players, we can measure them on a team level.
One note before I continue: On the team level, -WPA is good for a defense. But on a player level, I defined +WPA as good for the defense, which I believed would be less confusing than the term -WPA. But the terminology is inconsistent, and I apologize for any confusion. The two graphs below illustrate team defense, so negative numbers are better.
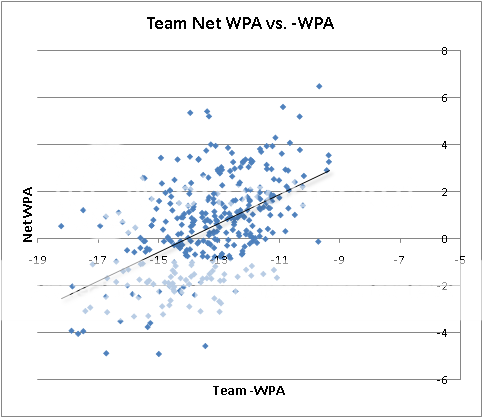
First, it's worth looking at how -WPA correlates with net WPA at the team level. As expected, it comprises a good deal of the variance of overall WPA, with a correlation coefficient of 0.52. The relationship is illustrated below for all regular season team defenses from 2000 through 2010.
The next graph focuses on the defenses of 2010 to illustrate the relationship between -WPA and +WPA. The blue bars show the component of 2010 regular season team defense WPA that is -WPA, i.e. successful plays for the defense. The green bars show the component of team defense WPA that is +WPA, i.e. unsuccessful plays for the defense. The red bars show the net WPA for each defense.
Notice the spread between -WPA and +WPA for each team. The total with of the blue and green bars indicates the degree of variance in the outcomes for each team. Teams like SD had very low variances, playing relatively safe and consistent defense. But teams like WAS had very high variances with a wide spread between total +WPA and -WPA.
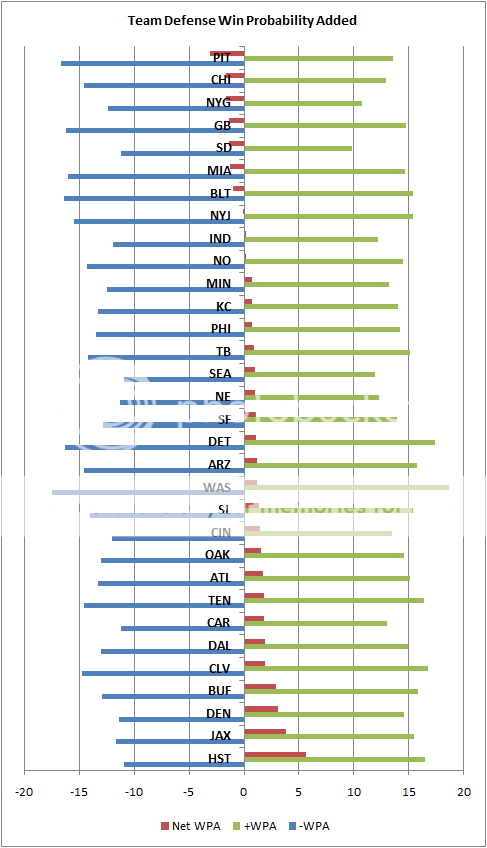
In fact, WAS had the most -WPA for any defense, but they were far from the best. I wondered if there was any correlation between high-variance defenses and net performance. If the Redskins had such a wide variance but a poor net WPA, there might be a systematic relationship between gambling-type defenses and overall success.
It appears that there may be 'types' of defenses in terms of their -WPA/+WPA spread. Based on team defense data from the 2000 through 2010 regular seasons, the correlation between defensive -WPA and +WPA is -0.37. This means there is an inverse relationship: the bigger a team's -WPA, the bigger its +WPA will be. I don't mean to imply that this is proof that teams intentionally choose either low or high variance base strategies. It could be that game situations or a team's offensive strengths dictate a certain risk profile on defense. It could be that poor defenses are just on the field for more plays, giving them more opportunities for both positive and negative outcomes. Much more research would be needed to understand what's going on. But whatever the causal relationship is, there is a relationship.
Further, the wider a team's spread between -WPA and +WPA, the worse the defense does on net. There is a weak but significant correlation of 0.09 between the spread and net WPA. Keep in mind that higher WPA numbers are bad on defense, so the worse defenses have higher variances.
One possible interpretation of these relationships is that defenses are too far on the risky side of of the risk-reward spectrum. They may be gambling too often.
An immediate implication is that +WPA for individual players might benefit from an adjustment that reflects their team's net WPA. For example, a guy like DeAngelo Hall who has a very high +WPA but whose team has a relatively poor net WPA could be penalized. If the Redskins defense has mediocre 2 WPA, and Hall's plays account for 15% of his team's +WPA, perhaps he should be assigned 15% of his team's 2 net WPA, for an adjusted +WPA of 0.30.
Nothing here is conclusive. There are some interesting relationships that suggest more research may be warranted.


"They may be gambling too often."
One swallow does not make a summer, but I think we can all look back to the blitz happy Giants who managed to blow a 21-pt lead and understand how a defense can gamble too often.
In fact, I question any of these defensive coordinators who make their name sending 5 or 6 guys every time on third and long. Sure, it looks cool, but does it really force 4th down more often than coaches who don't have a reputation to maintain?
I like that you are starting to look into the relationship between -WPA plays and indiviual players. However, without removing contexted i.e. the Leverage Index, these numbers and susquent recearch are going to be skewed. Until we start comparing WPA/LI numbers instead WPA numbers, I don't think we can draw any conclusions about defensive impact
Does it make a lot of sense to proportion defense +WPA to individual +WPA? It seems that, because we can't determine very well a player's -WPA that we are pricing in team -WPA, team +WPA, and player +WPA to determine player -WPA via net WPA, which seems wrong somehow. We would have to prove that the distribution of +WPA plays and -WPA is similar to individual +/- WPA.
In particular, if a player is bad at gambling, then I imagine his -WPA would be substantially higher than his +WPA even if the magnitude of both are high.
Hey Brian, love the site. I'm very new to advanced sports statistics, so please pardon me if this is a trivial or ill-advised question, but I'm having a tough time comparing the graphs. I can't be reading the first one correctly because it seems to me that it is saying that every team defense throughout that time period posted a negative WPA throughout their respective seasons (which I find extremely hard to believe) while the second graph clearly shows that a majority of the 2010 teams had a positive net WPA outputs. Can you tell me where I'm going wrong?
Brian, I know your site is not capable of doing game-charting like FO & KC Joyner of ESPN, but that is where you could begin looking--at least at the last few years. Although it is an imperfect science without All-22 film access and a knowledge of the defender's responsibility on a given play, it isn't impossible to assign success or blame on most plays.
One player who most football writers know gets shafted in everybody's stats is Nnamdi Asomugha. He had only 25 targets in the passing game in 2009--that's 1.5 per game. Most nickel corners see more action than that, and I would bet that some dime corners (or whatever you call the 4th CB on the depth chart) do also. Sadly, there is no counting statistic that will measure that kind of impact.
Also, for DB's, the fact that they are making tackles is usually NOT a good sign--it usually means they allowed a completion, or they are tackling a RB after he got past the front 7. And, the more tackles a defender racks up, that probably means his defense is on the field longer to give him more opportunities.
Don't know what to make of the relationship--but I'd bet that you're on to something with more time on the field allowing a D to rack up more positive AND negative plays.
I seem to recall a while back in one or the roundups there was a link to a baseball site showing how to take +WPA and -WPA to make wins and losses. If we can estimate playing time based on abs(+WPA) + abs(-WPA). Then perhaps we can distribute the teams total -WPA by estimated playing time. This assumes that the entire defense is at fault for -WPA and the more estimated playing time tohe more that player contributed to the entire defense.