
 NFL team efficiency rankings are back for 2008. The ratings are listed below in terms of generic win probability. The GWP is the probability a team would beat the league average team at a neutral site. Each team's opponent's average GWP is also listed, which can be considered to-date strength of schedule, and the ratings include adjustments for opponent strength.
GWP is based on a logistic regression model applied to data through week 3. The model is based on offensive and defensive passing and running efficiency, offensive turnover rates, and team penalty rates. A full explanation of the methodology can be found here. This year, however, I've made one important change based on research that strongly indicates that defensive interception rates are highly random and not consistent throughout the year. Accordingly, I've removed them from the model. Removing defensive interception rates from last year's prediction model did not harm its predictive ability by a single game.
There will be some surprises in the rankings, so take them with a heavy grain of salt. The results are so nutty, I considered not posting them. But the whole point of this site is to let the numbers speak for themselves, so here they are. This is the time of year that makes the least intuitive sense. Most fans, including myself, are wrapped up in how good various teams "should be" or "were last year." But those notions are based on old information mixed with media hype. With only 3 games of data, there's not a lot to go on. But at this point last year, 10 of the top 11 teams in GWP rankings went on to make the playoffs.
After week 3, the top team is 2-1 Washington, which stands out by virtue of its zero turnovers--no interceptions and no fumbles, lost or otherwise. Last year's AFC South powerhouses Indianapolis and Jacksonville are ranked 23rd and 24th , below even hapless Cincinnati. The explanation is in their respective strengths of schedule. The AFC North might be the strangest division, with 0-3 CIN leading in efficiency, and 2-0 Baltimore 3rd out of 4 teams. Lots more surprises below.
Click on the table headers to sort.RANK TEAM GWP Opp GWP 1  WAS
WAS0.72 0.61 2  ARI
ARI0.71 0.60 3  SD
SD0.70 0.50 4  DEN
DEN0.63 0.57 5  SF
SF0.62 0.45 6  NYG
NYG0.61 0.40 7  BUF
BUF0.60 0.45 8  DAL
DAL0.58 0.44 9  NO
NO0.57 0.55 10  PHI
PHI0.56 0.47 11  TB
TB0.55 0.57 12  CAR
CAR0.54 0.59 13  NYJ
NYJ0.53 0.55 14  MIA
MIA0.51 0.52 15  ATL
ATL0.51 0.34 16  CHI
CHI0.51 0.47 17  CIN
CIN0.51 0.64 18  MIN
MIN0.51 0.49 19  GB
GB0.49 0.48 20  OAK
OAK0.49 0.50 21  SEA
SEA0.48 0.51 22  TEN
TEN0.47 0.36 23  IND
IND0.47 0.48 24  JAX
JAX0.47 0.59 25  PIT
PIT0.42 0.37 26  HOU
HOU0.40 0.58 27  NE
NE0.38 0.42 28  BAL
BAL0.38 0.29 29  DET
DET0.37 0.62 30  KC
KC0.32 0.53 31  STL
STL0.29 0.58 32  CLE
CLE0.28 0.60
Week 3 Efficiency Rankings

Payton's Gamble
 In last Sunday's game between New Orleans and Denver, down 24-17 with 30 seconds left in the 2nd quarter, the Saints faced a 4th down and goal from the 1 yard line. Normally, all the numbers say 'go for the touchdown,' and this was indeed what the Saints' decided to do. I love aggressive decisions on 4th down, but we'll see why going for the field goal would have been the slightly better decision.
According to the Romer paper, going for it on 4th goal makes sense anytime the offense is inside the 6 yd line. The key to the advantage in going for the TD is that a failed attempt leaves the ball deep in an opponent's own territory. It's likely that the opponent will end up punting and giving the ball back in excellent field position, or even allowing a safety.
And that's exactly what happened Sunday. The Saints failed in their attempt, leaving the ball for the Broncos at the 1. On the very next play, the Saints stuffed a run and scored a safety. And even though they got 2 points out of the situation, it was a highly improbable outcome. They should have kicked the field goal.
The fundamental difference between the normal Romer-type expected points analysis and this situation is that there was under 30 seconds left in the half. Neither team had any time outs remaining, so neither team had time to mount a follow-on drive. The lack of time means that the benefits of the follow-on field position are very limited. It also means that the value of the ensuing kick after a score doesn't have to be factored in. With only a few seconds remaining in the half, a kick off would undoubtedly be of the 'squib kick to the 3rd string TE' variety. There's no chance it would be returned.
We can evaluate the decision in a simple expected utility calculation. The chance of scoring from the 1 yd line is 39%, and field goals are 99% successful from that range. The chance of forcing a safety from the 1, given an unsuccessful TD attempt, is 4%. (In the past 8 years, there have been 267 runs from the 1, featuring 12 safeties and zero fumbles. The Broncos would have been crazy to pass, so I'll ignore the possibility of an interception.)
= 7 * 0.39 + 2 * (1-0.39)(0.04)
= 2.73 + 0.05
=2.8 points
Value(FG attempt)= 3 * P(successful FG attempt)
= 3 * 0.99
= 3.0 points
The percentage play for the Saints would have been the field goal in this situation, but not by much. If for some reason Sean Payton thought his offense had a much better than the league-average chance of scoring from the 1, it would have made sense. But that would be a stretch given New Orleans' lack of a power running game.
To prevent a safety, Shanahan might have called for the QB sneak. The Broncos only needed to take a single snap, and the sneak is probably the most safety-proof type of play. I suspect that he feared a fumble more, and didn't want the ball in Cutler's hands in that situation.
This situation is a good example of how the end of the half alters the equation for decision making. Early in the half, we can treat the flow of the game as effectively infinite. But as the clock winds down, we have to account for the effect of an approaching time horizon.
What's a Safety Really Worth?
 Safeties are so cool. Nothing fires up a defense and demoralizes an offense like a safety. They also throw off the 7 and 3-point arithmetic that football scores almost always follow. I always enjoy watching the score ticker at the bottom of the TV and thinking, “PIT 7 CLE 5?...How'd they get...oh yeah.”
But safeties are rare, with only 109 of them over the past 8 years, or about 1 in every 20 games. They’re also unique because the scoring team gets the ball. A free kick from the 20 yd-line usually means pretty good field position, and this is what makes safeties worth more than you might think.
Say you won $7 in a lottery 'scratcher.' But to go claim your prize, you’d have to use about $1 of gas. You could get stuck in traffic and it could cost $2, but you might get a ride from a friend and it would be free. But on average it would cost a buck. How much is that lottery ticket worth now? Now apply the same concept to football.
After a touchdown or field goal, the scoring team has to give possession of the ball to its opponents through a kick off. The resulting average field position is the 27 yd-line. In contrast, after a safety, the scoring team gets the ball back with average field position at its own 40.
In abstract terms, a touchdown really isn’t worth 7 points. Given enough time for the opponent to score, it’s really worth 7 points minus the expected point value of having the ball at the 27. The same principle applies to field goals.
Similarly, safeties aren’t really worth 2 points. Their ultimate value is 2 points plus the expected point value of getting the ball at the 40. Teams with 1st downs at their own 40 can expect to score 1.6 points on average, (assuming there is time to mount a drive). This makes the net value of a safety 3.6 points.
The table below lists the scoreboard point value of each type of score, the associated expected value of the ensuing kick, and the resulting net value. Score Type Point Value Kick Off Value Net Value Touchdown 7 -0.7 6.3 Field Goal 3 -0.7 2.3 Safety 2 +1.6 3.6
Two-point safeties are actually (or abstractly, if you prefer) worth more than three-point field goals. And more importantly, field goals aren't almost half the value of a touchdown. They're worth closer to a third.
Predictability on 2nd and 10
 For any down and distance situation, a defensive coordinator wants to know how likely a run or pass play will be. He needs to select the right personnel and the right defensive scheme for the situation. Take the 2nd and 10 situation, the second most common down and distance combo in the NFL (1 in 5 of all 1st downs results in a 2nd and 10). In general, offenses tend to pass 55% of the time and run 45%. So defensive coordinators need to be equally prepared for any kind of play type. Or do they?
For offenses to be most effective, they need to be unpredictable. In the 2nd and 10 situation, this means defenses would have to prepare for the nearly equal chance of a run or pass. Many analysts refer to 'balance' as the key to unpredictability. But balance itself doesn’t matter if the offense is predictable in achieving its balance. Running and passing on every other down would provide perfect balance but would be completely predictable. That’s why randomness is at least as important as balance to keeping the defense on its heels. Anything other than random play selection provides a pattern, however subtle, that an opponent can detect and exploit.
In a recent article, I discussed an interesting pattern in NFL 2nd down plays illustrated below. Note how runs are far more common on 2nd and 10 than either 9 or 11 yards to go. The graph is basically continuous and smooth except for a notable spike in run plays on 2nd and 10.
This struck me as odd because 2nd and 10 is not tactically different than 2nd and 9 or 11. The situations are basically the same. My theory was that offenses were running more frequently on 2nd and 10 because that situation arises most often due to an incomplete pass, and offenses tend to predictably alternate between passes and runs. This would result in the unexpectedly high percentage of run plays on 2nd and 10.
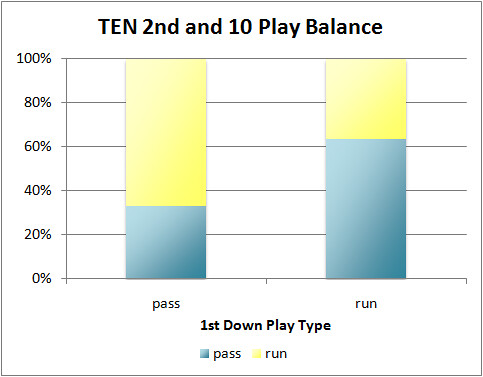
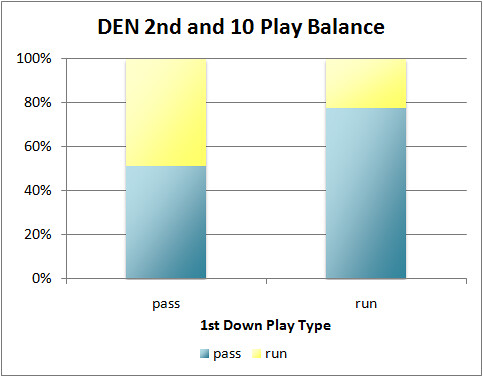
I’ve dug into the data now, and I’ve confirmed my suspicion. The graph below illustrates the relative share of pass and run plays based on what kind of play the preceding 1st down was. On 2nd and 10, teams indeed run more often after a pass than after a run, and vice versa.
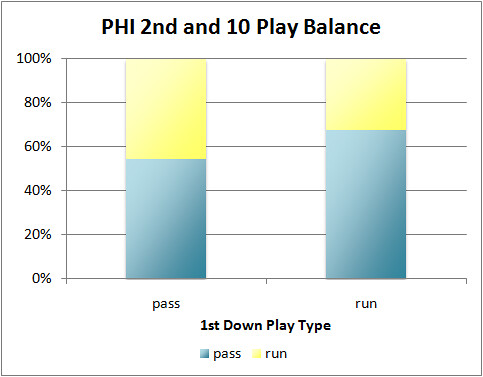
(The data consist of 14,384 2nd down plays in the 1st through 3rd quarters of all regular season games from 2000-2007. Fourth quarter plays were excluded to remove the possible biases from 'trash time' and running out the clock.) The graphs should be read as follows: The left column are 2nd down plays following a pass, and the right column are plays following a run. The blue portion of each column is the % of pass plays, and the yellow portion is the % of run plays.
This is significant because armed with this information, defensive coordinators can select personnel and plays tilted toward the anticipated play type. They no longer have to be on their heels without an idea of what to expect on 2nd and 10. If the previous play was a run, a coordinator can now be 72% confident the next play will be a pass.
But not all teams have the same tendencies. Compare Brian Billick’s Ravens with Bill Cowher’s Steelers over the 2000-2006 period. The Ravens were far more predictable compared to the Steelers. Cowher’s teams selected 2nd down plays without regard to what kind of play was called on 1st down, but Billick’s teams tended to follow a run with a pass.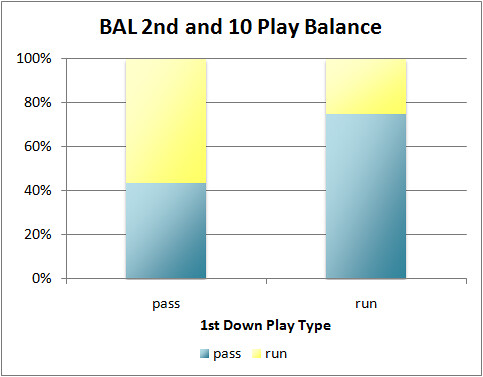
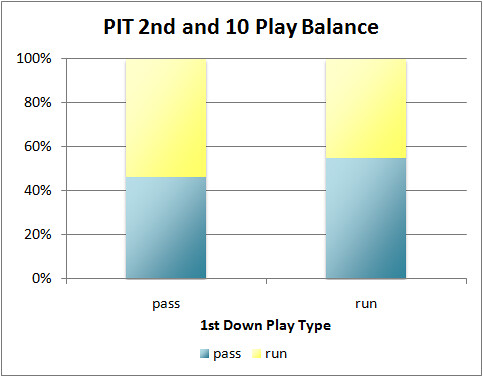
(Statistically, the Ravens’ difference in proportions is significant at p<0.001. Typically, a single team’s proportions would need to be within about 8% to be considered non-significant. But that still would not indicate good non-predictable play calling independent of the previous play. The proportions would typically need to be within 3% to be more likely due to randomness than not.)
One counter-argument to this analysis is that teams are wisely choosing to run after an incomplete pass. If a pass falls incomplete, that would be fresh evidence about an offense’s ability to complete passes against this particular opponent. A run stuffed at the line is similarly an indication of each team’s relative strength. Shouldn’t offenses shy away from unsuccessful tactics? Doesn’t it make sense to try the alternate strategy next?
I would say no for two reasons. First, this would be a classic example of the small-sample fallacy, otherwise known as the hasty generalization. Over 40% of all passes are incomplete in the NFL. The outcome of a single pass should not be the basis of a change in strategy, however slight. The sample size of an entire game of passes would still not be enough to make conclusions about its relative merits as a strategy against a particular opponent. Second, even if the evidence of the single trial were so overwhelming, tending heavily toward the alternate play type on successive plays makes the offense too predictable, as we’ve seen here.
Coaches and coordinators are apparently not immune to the small sample fallacy. In addition to the inability to simulate true randomness, I think this helps explain the tendency to alternate. I also think this why the tendency is so easy to spot on the 2nd and 10 situation. It’s the situation that nearly always follows a failure. The impulse to try the alternative, even knowing that a single recent bad outcome is not necessarily representative of overall performance, is very strong.
So recency bias may be playing a role. More recent outcomes loom disproportionately large in our minds than past outcomes. When coaches are weighing how successful various play types have been, they might be subconsciously over-weighting the most recent information—the last play. But regardless of the reasons, coaches are predictable, at least to some degree. Fortunately for offensive coordinators, it seems that most defensive coordinators are not aware of this tendency. If they were, you’d think they would tip off their own offensive counterparts, and we’d see this effect disappear.
In case anyone's interested, here are some other team’s tendencies on 2nd and 10. I picked these teams because they’ve had the same head coaches over the entire period of the data set. 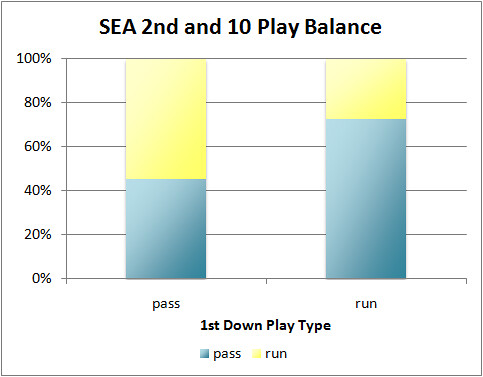

Predictability
 Over the past few months I've been writing about how game theory can help us understand play-calling in football. Not only can it help us understand why coaches call the plays they do, but it can instruct us on what the optimum balance of play types should truly be. Offenses always need a mix of strategies to maximize their gains, no matter how much better they might be at running over passing or vice versa. But just important as the ratio of the strategies is the unpredictability of each call.
The mix of plays needs to be random to be effective. That's not to say play calling should be picked willy-nilly out of a hat. For every situation there will be an optimum ratio of play types. For example, on 3rd and 1 situations, teams should generally run at least about 85% of the time. But within that 85/15 run-pass mix, the decision needs to be unpredictable, which means it must be random and independent of the previous play call. The problem for play callers, and the opportunity for defensive coordinators, is that people are terrible at randomizing.
There's a story about a statistics professor who challenges his class to a contest. He divides the class in half and tells one group to flip a coin 100 times and write the sequence on the board-- THHTTH... The other group is told to invent and write their own sequence of heads and tails on the board as randomly as they can, without looking at the other group's sequence. The professor says that if he can't tell the true random sequence from the fake one, he'll give everyone an A (or something). He leaves the room until both groups are done, then returns and instantly spots the fake sequence. The professor can identify the fake random sequence so easily because it has too many alternations between heads and tails, and too few long streaks. The fake sequence looks like HTTHTHHTHT, while true randomness often looks like HHHHHTHTTH. True randomness can be quite streaky (which is partly why people fall for fallacies like "being in the zone" or "the hot hand").
If I'm a defensive coordinator, I'd like to know what kind of play the offense is going to run. I don't need absolute certainty--any idea is better than no idea. For example, for all 2nd and 10 plays in the NFL, offenses run the ball 46% of the time. But what if defensive coordinators could know that based on other circumstances, this particular 2nd and 1o will be a pass 80% of the time?
Take a look at run-pass balance on 2nd down situations. The graph below shows the percentage of run plays on 2nd downs according to the yards-to-go situation. There is one noticeable aberration at 2nd and 10: runs are far more frequent.
Why would runs be far more frequent on 2nd and 10 yards to go than on 9 or 11 yards to go? The task facing the offense is not meaningfully different. What makes 10 yards to go so special?
The key is that 2nd and 10 situations are several times more likely to occur due to an incomplete pass than due to a run for no gain. This suggests that, effectively, teams are significantly more likely to run following a pass than pass following a pass. Therefore, offenses are not randomizing as much as they are alternating.
Play calls are not independent of the previous plays, even for similar down and distance situations. NFL offenses are therefore substantially, although not completely, predictable.
Instead of HTHHTHTH in a statistics class, we have RPRRPRPR in football. The patterns remind me of a language with consonants and vowels. But play calls are not simple either/or run or pass decisions. There are several variations to each, just like there are a's and e's and b's and c's.
Linear B was an ancient written language found in Crete and named for its straight lines. It was a precursor to the Hellenic Greek language dating back to the times of the Homeric epics. Several tablets with etchings in Linear B were excavated in Knossos, thought to be the capital of King Minos. The script was completely unlike any other, and baffled archeologists for decades. Researchers had nothing to go on except the patterns found in the writing. In the mid-1940s Alice Kolber, an American professor, theorized that the characters represented syllables and that the language was highly inflective (having lots of different conjugations). Then in the 1950s, an amateur archeologist named Michael Ventris cracked the code. He found that each character represented a consonant-vowel combination. Each sound a person can make either goes well with others or it doesn't. This was all that was needed to eventually decode Linear B and unlock all its secrets.
Just like vowels and consonants, runs and passes tend to alternate. And certain types of plays tend to work well before and after others, just like "th" or "rn" or other consonant combinations.
I'm not claiming that we can crack the code on play-calling any more than you can predict my next word. My point is that a serious cryptographic analysis of play-calling could reveal tendencies not previously thought possible. For example, try to predict the next letter of the word "th..." Chances are very good it's a vowel, and if it's not, it's got to be an 'r.'
I'm sure coaches pore over hours of film trying to discern opponent tendencies, and are looking for things I couldn't even fathom. But it seems that they are focusing on situations in isolation. They're zeroing in on observations like, "they run on 2nd and long 35% of the time in the red zone." Apparently, coaches are not picking up on the fact that the same team might run 65% of the time in the same situation following a pass. If they were detecting these patterns, they wouldn't let their own offenses be so predictable.
I realize this is a wondering essay. My main points are that:
I was going to finish this article by retelling an Edgar Allen Poe story in The Purloined Letter. But as I researched the details of the story, I realized I was beaten to the punch by the Smart Football blog. Check out this article on Poe, rock-paper-scissors, and play-calling.
Blindsided?
 Michael Lewis, author of the best-selling baseball book Moneyball, recently followed up with a book on innovation in football. The Blind Side follows the story of the left tackle, the player whose job of protecting the more vulnerable side of right-handed quarterbacks has become increasing important in the NFL ‘arms race’ of the pass rush vs. passing offense.
The entirety of Lewis’ premise is based on the relative pay of LTs compared to other positions. Lewis cites the fact that LT has become the second highest paid position, behind only the all-important QB. Unfortunately, the comparison of LT salaries with those of other positions is a false comparison, and a fairer comparison reveals a different story.
I was intrigued by Phil Birnbaum’s response to a write-up of Blind Side at the Freakonomics blog. Phil questioned the justifications for the extremely high salaries for LTs. And although I believe there are sound economic reasons based on the scarcity of qualified players and the contribution of the position, my main concern questioned the premise that LT salaries are truly any higher than other positions.
Like many other positions, offensive tackles are largely ’swappable’ in that they can go from left to right pretty easily. Most backups don’t even have a defined side and are available to fill in on either side to spell a starter or replace him in case of injury.
Due to the 'blind side' consideration, the LT is almost always the better of the two starting tackles on each NFL team. And he’s very likely to make a lot more money than the lesser player who is assigned RT. Starting LTs are basically a group of the #1 offensive tackles from each of the 32 teams.
So when we compare average salaries of LTs to those of say, left corner back or all starting wide receivers, the comparison is not fair. Those positions do not place the better player on a certain side, or they are not defined as left/right positions to begin with. And if a player does always line up on one side, it’s not always the same side for every team.
If we compared the average salaries of LTs to the average salaries of all the best WRs from each team, we might expect to see drastically different results.
A much fairer comparison of position salaries is to compare the average salary of the 32 top paid offensive tackles, whether left or right, with the top 32 salaries of players at WR, CB, or various other positions. So that’s what I did.
I looked at the average of the top 32 salaries of 2007 at OT, QB, WR, CB, and RB. Because a player’s salary is a convoluted mix of regular salary, signing bonuses and other bonuses, I favor salary cap charges as the best measure of salary. A cap charge is basically a player’s base salary plus an amortized amount of bonus salary. I think it’s the best measure because it most realistically reflects the value of the player to the team. Total salary and base salary, the only other plausible measures, can be highly irregular based on the particular timing of bonuses. However, I’ll include all three types of salary below the graph, and you can judge for yourself.
The graph and table below list the salaries in $millions for the 32 highest paid players at various positions.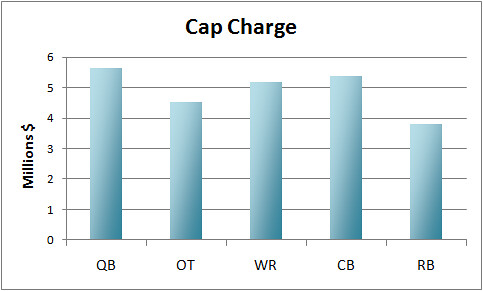
QB OT WR CB RB Base Salary 2.9 2.3 3.5 3.3 1.8 Total Salary 5.8 4.9 5.7 5.7 4.9 Cap Charge 5.6 4.5 5.2 5.4 3.8
The 32 highest paid offensive tackles, whether left or right, rank only 4th out of 5 in all three measures of salary. I haven’t looked at other positions yet, so there may be others that are higher paid than OT. Further, only 33 of the 100 top paid offensive linemen were tackles, left or right.
While I agree LT is a critically important position and should be highly paid, the comparison of salaries against other left/right positions, or non-“sided” positions is severely biased. A fairer comparison reveals that the top players at other positions are paid even higher salaries.