
 This is my favorite post of the year. It's an annual opportunity to look back over all the interesting analysis, features, visualizations, and analytical tools we've been able to put together at ANS. Great thanks to Keith Goldner, Dave Collins, Sterling Xie, Rob Hendryx, and Kevin Meers for making 2013 another successful year. (Here are the best-of posts of 2009, 2010, 2011, and 2012. They're a great way for new readers to come up to speed.)
I said this last year and I'll say it again. With each passing season I start to feel like we've peaked. Maybe all the low-hanging fruit of football analytics has been plucked, and there's little left to do but become a broken record on a handful of subjects. But this stuff is too much fun to give up. And so sure enough, over the course of another season we stumble on a few more insights and push the envelope just a little further. And interest continues to grow too. 2013 was the best year yet in terms of traffic to the site, and December was the site's best month ever.
With every new feature, ANS becomes a little bit harder to run throughout the season. So please forgive me as I take a breath, step back and highlight some of what we consider some of our favorite stuff. Of our 219 total posts in 2013, here are a few of the best...
With the AFC playoffs appearing to go through Denver throughout last January, I took a look at the effects of altitude on FG success.
Keith analyzed John Fox's decisions in his team's upset at the hands of the Ravens. Here are my own two cents in a post at Slate and Deadspin.
I finished up the series on when to intentionally allow a TD with a look at what the numbers say for when teams are tied. This was possibly the most challenging bit of analysis I've done, and it spawned the time calculator tool, which got a major upgrade last January.
I took a look at how much QB clutch performance persists from season to season.
February started with a look at how Joe Flacco's magical post-season over-performance compared to that of other QBs in the recent past.
The Super Bowl was one of the more interesting and exciting championship games in memory. It featured a fake punt, an intentional safety, and a couple crucial 4th down decisions. It was also a case study in saving your timeouts.
Best of 2013

Chargers Courageous Call & Playoff-Clinching Drive
 Despite the controversy surrounding an illegal defense on the Chiefs' missed field goal at the end of regulation, the San Diego Chargers defied odds and clinched a postseason berth on Sunday. In overtime, Philip Rivers orchestrated a 17-play, nine-and-a-half minute field goal drive to start the extra quarter that ultimately sealed their win. The length of the drive, in this case, is just as important as the outcome as San Diego could advance with either a win or a tie.
Using our Markov model, let's take a look at the drive. Keep in mind, the model is best used for a standard drive when time and score differential would not greatly affect decision-making or play-calling. Since this was the opening drive of overtime, those standards will predominantly hold true, although not perfectly given the leverage of the situation.

Sunday's Numbers Have Been Crunched

Advanced stat box scores
Top QBs of the week
Top RBs of the week
Top WRs of the week
Top TEs of the week
Top Defenders of the week
Advanced team stats
Offensive player season leaders
Defender season leaders
Team Viz
Position Leaders Viz
QB Viz
RB Viz
Amazing Sunday
Here are my quick hit observations on week 17 of the 2013 season.
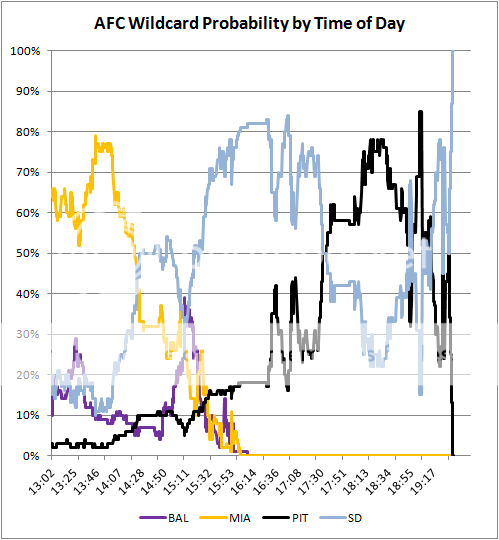
AFC Wildcard Probabilities Through 4pm
Not much to add here. The graph says it all. Sorry, Dophins fans. And I was getting my own hopes up right around 3:15. Don't forget--live playoff probabilities all day today on the main page.

Live Playoff Probabilities Today

But wait, there's more! If you call now, I'll throw in a free overall-first-draft-pick probability.
With all the games that have playoff implications, this should be a lot of fun today, especially during the 1pm games. But this is something that's only useful one day out of the entire season, so please don't wait to spread the word: Tweet
A few notes about the playoff probability widget:
Tony Romo and High Variance QBs

Romo has a reputation as a choker, mostly due to his team's late-season under-performance. But taken as a whole, his numbers are very "clutch." He has ranked 8th, 5th, 6th, 3rd and 12th in QB WPA over his last 5 (non-injury seasons). I don't buy the choker label, but I do buy the notion that he's a gambler and an improviser, which can cause wide swings in his game-to-game WPA numbers. So I thought I'd pull the stats and investigate how Romo compares in terms of his game-wise variance.
Variance measures how wildly a stat changes. In this analysis, I measured the variance of week-to-week WPA. If a player has lots of heroic games and lots of calamitous games, his WPA variance will be high. If a player is relatively consistent from week-to-week, regardless if he is consistently good or consistently bad, his WPA variance will be low.
For those who are unfamiliar, variance is an average of the squared deviation from each player's mean WPA. For statistical sticklers out there, I used variance of a population rather than variance of a sample--otherwise players with relatively few starts would have a slightly inflated result.
This season, Romo ranks only 14th in game-to-game WPA variance out of the 41 QBs with 200 or more qualifying plays. He's also 14th over the past 5 seasons. If we go back to 1999, the earliest year of my data, he ranks 9th out of the 101 QBs with 800 or more qualifying plays. His early career was apparently very boom-and-bust.
Here are a three tables of QB WPA variance. The first is for the 2013 season through week 16. The second is for the last five seasons. And the third for the period 1999-2013.
Podcast Episode 14 - Chase Stuart
Chase Stuart returns to the show just in time to discuss his latest Football Perspective research. Dave and Chase begin by breaking down the historical context of Peyton Manning's single season passing touchdown record. They then cover the Carolina Panthers and break down the changes they’ve made over the past year, the storylines surrounding Cam Newton, and how overall team performance can sometimes obfuscate an individual player's development
Next, Chase takes to his soapbox to make the case that the Jets should fire Rex Ryan and explains how retaining him would set a unique historical precedent. Next, they turn their sights to the Giants and discuss what to make of Eli Manning’s interception spike.
The episode concludes with a look ahead to the week 17 Bears/Packers and Cowboys/Eagles matchups. Chase weighs in on what he’s most excited for in this year’s playoffs, and why playing a Superbowl outdoors might actually be more fair than playing in a dome.
Subscribe on iTunes and Stitcher