
 Lately I've been using the concept of 'Expected Points' (EP) as a measure of success for football plays. It's been the foundation of much of my analysis of fourth down decisions, onside kicks, run-pass balance, and even touchbacks.
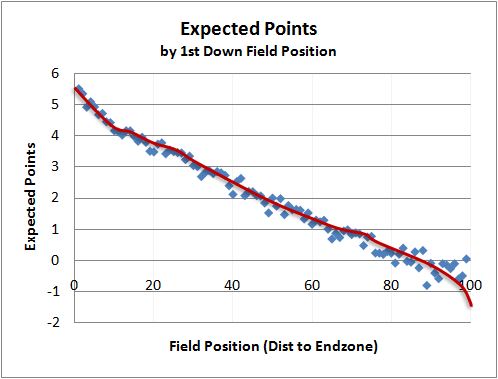
Every down-distance-field position combination has an average net point advantage. For example, when an offense has a first and goal at their opponent's 1-yard line, they can expect about a 6-point advantage over their opponent in the long run. A first and 10 at midfield is worth about 2 EP.
Expected Points on first downs are easy to compute because there are so darn many 1st and 10s compared to any other down and distance combination. Here is the EP chart for 1st and 10 (or goal) from my fourth down study earlier this season.
What about the other downs? For 2nd and 3rd downs, it's not nearly as simple as averaging the the next scores for each field position. There is considerable noise (or sample error) because there are relatively few cases of each down-distance combination. To get reasonable estimates for later down situations, I used a smoothing technique called LOESS, which is a fancy way of drawing a crayon through a collection of noisy data points. The challenge was to get estimates that were consistent across three dimensions: field position, down, and distance to go.
The graphs below are the results. They're kind of eye charts, so click to enlarge and see the full Crayola rainbows.

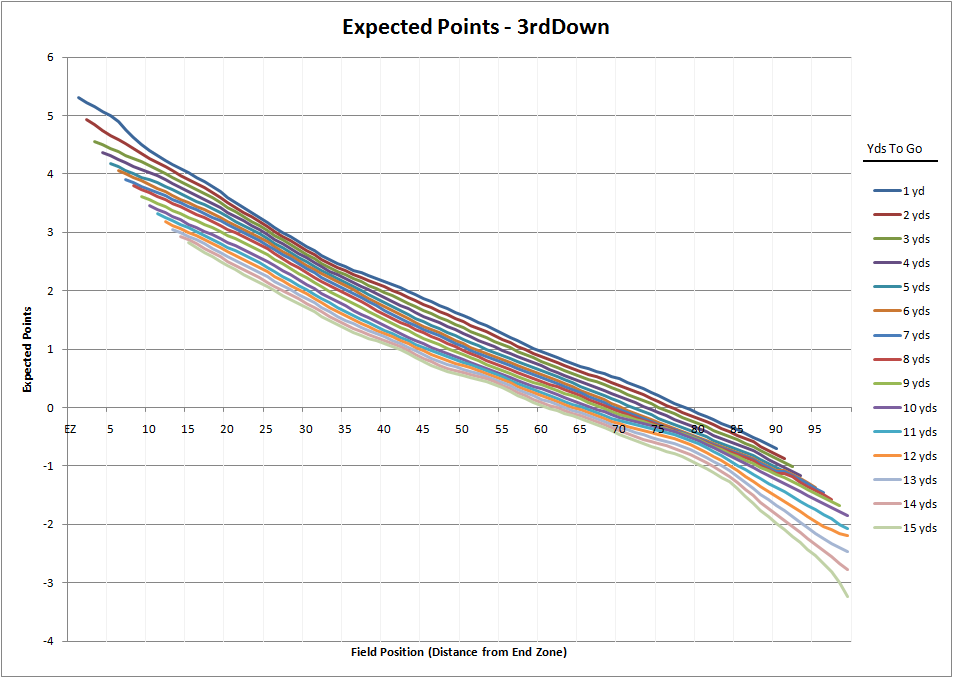


It is interesting that the 3rd and long values really tail-off close to the offense's own endzone (while 2nd and long don't). I guess it's probably because teams are too conservative in those situations.
Also I was wondering if you think there is a selection bias by just using the raw numbers. For example, good offenses are going to have more red zone opportunities and bad defense will give up more red zone opportunities. So the measured expected value in the red zone might be higher than the true expected value. Or do you think that this would only have a minor effect on the data?
Brian
Thanks for making the data available, now I'm not going to get much done around here. Made a donation to Fisher House as payment for these. Thanks again and Merry Christmas.
deltawhiskey
Brian,
Long-time reader, first-time commenter. This is some excellent work, something I've always wanted to do myself. Two questions:
1) I've read before that you are factoring only normal situations in EP analysis. I agree with that, since WP would be better when discussing higher/lower leverage situations. But does this mean that you are excluding plays that are, for example, late in second and fourth quarters?
2) What is your data set for these charts?
Thanks. Again, great work.
Yes, these are for 1st and 3rd qtrs.
Data set is all NFL non-preseason games from 2000-2008.
Eiad-Yes, there is going to be bias toward the red zone. Better teams get in there more often.
That is freaking awesome! I'm not sure what to do with it because my head is just exploding with possiblities.
For the 4th down data you don't have any distance. Does that just average all 4th down numbers?
On the 4th downs, yes--for now. The EP values for 4th & each to go distance depend on whether the coach goes for it or not, which we don't know until the decision is made. For those, you can refer to the 4th Down Study results for now.
@Eiad - I bet that downturn on 3rd and long at your own goal line is related to short punts because the punter doesn't have enough room. On 2nd you have two chances to gain 5-7 yards and at least be able to get a good punt off. By third and long you only have one chance left.
That would produce a big dropoff but maybe it doesn't explain it all because 3rd and long from your own 5 is actually WAY worse then 4th down from your own 5.
3rd and 15 from your own 5 is worth -2.31 ep and 4th down from your own 5 is worth -1.41 ep. I would expect that most 3rd and 15th aren't converted and lead to a 4th down punt at the 7 to 10 yardline (average 2-5 yards on that play).
If that was true then you'd expect 3rd and 15 from the 5 to have the same EP as 4th from the 7 but it's much worse. I'm guessing that there are a lot of safeties when the teams are trying to complete long passes from their own endzone.
3rd and 10 from your own 5 is with the same EP as 4th from your own 1 yard line. That seems counter intuitive so the only thing that I can think to explain it would be safeties.
Brian has demonstrated that safeties are very costly because of the 2 points and possession of the ball with good field position (it's a free kick which generates better field position than a kickoff on average). I think that a safety was worth more than a field goal in his example.
One last observation, a 4th down from your own 1 yard line is worth -1.62 which is the same as your opponent having the ball on their own 42 yard line. I'm surprised that 4th down on your own one results in such a good punt. I'd expect the opponent to have the ball at my 40-45 which is -2.42 to -2.72 points for me.
Hey Ben,
I just want to quickly address the last point you made about 4th downs from your own 1 having a higher expected value than you anticipated. I think part of the reason is that teams sometimes get a first down via a roughing the kicker penalty. Also, I would imagine that there are some muffed punts that result in teams getting the ball back.
Correct me if I'm wrong, but based on these numbers it appears that it's better to punt on 3rd and long inside your own 5-yard line rather than risk a safety or turnover going for the 1st down.
In other words, treat the 3rd down as a 4th down, and the EP appears to improve dramatically.
Interesting. I'll have to check the unsmoothed values around there and see if that's the case. If so, that would be interesting.
I think if it's true, it's because teams are passing on 3rd down and giving up too many turnovers deep in their own territory. So it's not the 3rd down itself, but the pass on 3rd down. Instead of punting on 3rd, I'd just run far more often.
Good points made above. I did look at the numbers a while back for quick kicks on 3rd down and if I remember correctly there can be a reasonable benefit to kicking on 3rd and long with your QB (one of the factors I considered was that on a quick kick there's going to be little or no return).
Here's another interesting tidbit, when you graph the EP for 1st and 10 vs 2nd down it becomes clear that 2nd and 6 has a lower expected point value. So a 4 yard run on first down is actually lowering your EP.
2nd and 4 is actually the closest to 1st and 10 (Brian had posted that 2nd and 5 was what he'd rank a success based on the chance of continuing the drive). Since passing is more likely to gain 6 yards than rushing that seems to backup Brian's suggesting that passing on first down is in a team's best interest.
Football outsiders considered 4 yards on 1st down to be a success. I wonder if they should reconsider that.
That's true, 2nd and 6 is worse than a 1st and 10, but only if you're looking at the same yard line. The 2nd and 6 has to be 4 yds closer to the end zone. That's why 2nd and 6 is the break even in terms of EP. Even if you punt, it'll be 4 yds further downfield. But in terms of 1st down probability, 2nd and 5 is the break even.
Brian,
I think that looking at expected points added/subtracted would be a much better way to measure MVPs than the "win probability added" system you tried out a couple weeks ago. WPA is highly context-dependent, and players don't really have control of that context.
@Brian - Yeah, I realized that after I posted but I needed some time to figure out what the actual break even point was. It is indeed 4 yards on first down.
Interestingly, 2nd and 6 is slightly worse than 1st and 10 inside your own 20. Then they are the same until your opponents 40. Then 2nd and 6 is slightly better than 1st and 10 for the rest of the way.
I still think that Football Outsiders is wrong to use 4 yards on first down as a "success". That is the break even point. Anything less is good for the defense and anything better is good for the offense. I'd say that 5 yards on first down is a success and 4 yards is a push.
Click on my name to see the graph
Brian,
First, hello from Herndon. In your "Adjusting Adjusted Yards Per Attempt", you mentioned that an interception is about -3.8 EP. You mentioned that an Interception compared to an Incompletion is only 3.2 EP. I just crunched the number using your EP values spreadsheet in this post (Thanks!), and the difference between Dwn&Yds and Dwn+1&Yds averages out to .61 on my spreadsheet.
Am I correctly interpreting that an incompletion averages out to "cost" a team .6 EP?
And am I correctly reading your EP chart that .6 EP equates to 11 or 12 yards?
Brian,
I was wondering if you could share a bit about the process you used to smooth your graphs. I'm working on creating my own model, and I've run into the problem of having 2nd and 4 be worth less expected points than a 2nd and 5, even after smoothing with LOESS. I was only smoothing across distance from goal. Did you also smooth across YTG?
Thanks,
Matt
Matt- In a nutshell, yes.
Brian,
To elaborate on the last question by Mr. Jaffe, how were you able to also smooth across YTG and associate all the YTG distances so that the 2nd and 4 line is always higher than 2nd and 5, which is always higher than 2nd and 6 and so on?
I am performing a similar analysis for use within the CFL, therefore I have a smaller sample size of each down, distance and YTG. After performing a separate lowess curve for each YTG distance I am experiencing the same situation as Mr. Jaffe where a 2nd and 4 may be worth less expected points than a 2nd and 5, etc.
I want to use my 2nd and 10 lowess curve and create the other YTG curves based on this curve, moving the points up or down by a predetermined factor. Is this what you did? Any comments into the methodology would go a long way in helping. Thank you kindly from Canada,
Matthew