
 Is it me, or do I sense that teams are going for it more often on 4th down this year? And maybe I'm imagining things, but I also get the feeling that teams have been even more daring since the Belichick 4th down decision against the Colts.
The three graphs below tell the story. The top two graphs depict the proportion of 4th down decisions by field position. The first graph is for the 2000-2008 seasons, and the second is for the 2009 season. The third graph isolates just the proportion of conversion attempts by field position so we can better compare the previous seasons with the current season.
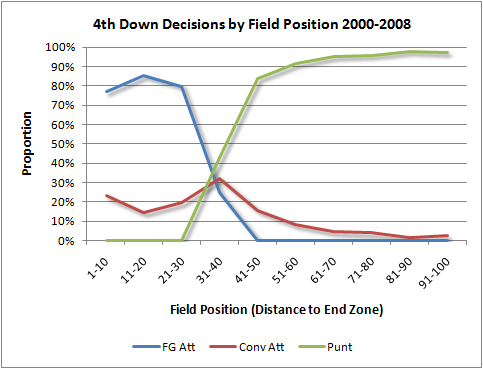
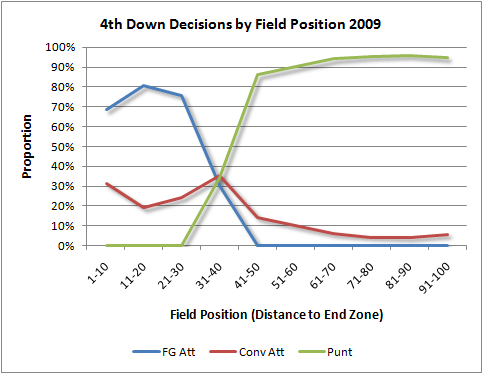

As you can see, there is measurable increase in 4th down conversion attempts so far in 2009 compared to previous years. It's small--overall just 14.7% compared to 12.4%.
What about since the Patriots-Colts game? Since then, 4th down conversion attempts have increased from 14.1% to 16.0%.
So yes, teams are going for it more often, but not by much. It's probably too small of a difference to notice just by watching a sample of the games each weekend. But it is a start. The revolution is here--it's just moving in slow motion.


I assume all the differences noted are significantly significant at p=0.05 (or p=very small). Is this correct?
Adam, that was my first thought as well. Brian, can you confirm the data is significant? Can you supply the p-value for this?
4th down go-for-it rates tend to fluctuate slightly from one year to the next. For example, NFL teams went for it more often in 2007 than they did last season. There has been very little change since Romer's paper made headlines in 2002.
Yeah, any chance we get some more colors (like 2002, 2003, 2004, 2005, 2006, 2007) added to the first graph? I have a hard time believing that 2.5% isn't anything more than standard year-to-year fluctuation.
That's what the test for significance is. Because there is random variation from year to year we need to know if this percentage from this year is actually significantly different than the previous years. If it's not a significant different (say, a p-value above .05, or even .10) than it's just the random fluctuation from year to year.
One point Brian. Although it may average out over the data set, is it possible that random variations have meant teams have faced shorter than average 4th downs this year? This would result in a similar phenomenon to 3rd down conversion percentages. A team who faced 3rd and 1 every 3rd down would have a higher conversion rate than a team that faced 3rd and 5 for instance.
Of course, shorter than average 4th downs could themselves be an indicator that coaches are more prepared to go for it. If you decide before a series that you will go for it on a 4th and 1 then your play calling will be slightly different (e.g. on 3rd and 5 you would be happy to call a draw because you could easily get to 4th and 1 with it - a coach who didn't go for it would try passing more and would face a longer 4th down in the event of a failed 3rd down)
I would think you'd also have to adjust for the score. 2009 has seen a lot of one-sided games, which would lead to more losing teams going for it out of desperation.
Anonymous - that's a great point. Fortunately Brian has his Win Probability calculator so could, if he wanted, do some filtering to see if teams are going for it more often in non-desperation situations (for instance, a look at the % of Go For Its when the WP is 25-75%). It would be interesting if coaches are going for it more when the game is still close.
You guys are completely right. Significance is important, and it's highly unlikely the intra-2009 post-Belichick rate is significant with the current number of cases. Further, I haven't accounted for to-go distances yet, which could be important.
That said, my point was to only confirm or deny the appearance that teams are going for it more often, or was it just our imagination. The answer is yes, they are, and it has increased since the notorious 4th and 2.
I did make the 'revolution' crack, which was just my own irrational exuberance showing through. I probably should have left that out...
When the season's over, I'll take a more rigorous look at 4th down rates.
By my count, there have been a total of 3224 fourth down "decisions" this year. 474 of them resulted in the team going for it.
If 12.4% is the true expected rate, then we would expect that number to be 400. So it's a difference of 74...I don't know if that is statistically significant though, as it's been awhile since my stats class. ;)
Jonathan, I'll take a shot:
p = .124 (expect proportion of "going for it")
q = .876 (1-p)
p1 = .147 (observed proportion of "going for it")
n = 3224 (sample size)
z = (p1-p)/sqrt(pq/n) (test statistic)
z = (.147-.124)/sqrt(.124*.876/3224)
z = (.023)/(.005805) = 3.96
For a 1-tailed test, p(z=3.96) = .0000375. So, yes, 14.7% is very much a significant difference IF that sample size of 3224 is correct (seems high to me - I didn't try to verify it).
This says nothing about cause and effect, however. The higher percentage of conversion attempts could be caused by more short yardage downs that might be caused by something else, as pointed out earlier.