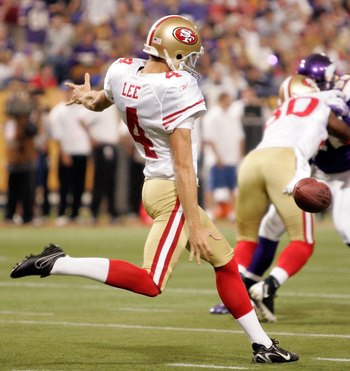
In Sunday's game between the San Francisco 49ers and the New York Giants, neither team really established statistical superiority. The Giants ended up with more yards (395 to 305) and more passing completions (26 to 19). The 49ers were more efficient, recording 0.7 more yards per rush and 0.5 more yards per adjusted pass.
It should come as no surprise, then, that the game was close for much of the way. The score was within a touchdown from the opening kickoff until the 12:26 mark when Kendall Hunter rolled in for a score to put the 49ers up 27-13. Neither team had a win probability greater than 75% in the first half. Outside of a few moments at 76% for the 49ers in the third quarter, the same applied to the second half until an Alex Smith touchdown to Vernon Davis gave the 49ers a 20-13 lead, the last lead change of the game.
The importance of field position tends to be a go-to talking point for announcers. A great offense or a great defense can, at times, render an opponent's field position advantage useless. In games like this one, however, with two teams of similar strength, field position can be the entire difference. Observe, a chart of the starting field position for every drive in the game:
Click here for a fully detailed and slightly larger look. The teams are separated by color, and in cases where both are close, the 49ers' result is on top and the Giants' is on the bottom (except for drive 10). The size of the mark indicates the number of plays in the drive.
The difference is striking. The 49ers offense was treated with three drives inside the 50 and another one fewer than 60 yards away from the end zone, leading to both their touchdowns and 18 (due to a two point conversion) of their 27 points. The Giants, on the other hand, were never once closer than 79 yards to the goal. Part of this was a good job by the 49ers to avoid three-and-outs and avoid deep punts.
Of the 49ers' four drives from inside their own twenty, only one of those resulted in a three-and-out -- and even that one saw a holding call on the Giants' punt return team. The Giants saw four drives of their own start inside the twenty and end within three plays -- two punts, and two Eli Manning interceptions. As a result, the 49ers only had to go an average of 62 yards on their 10 drives (before kneeling to end the game). The Giants had to go a whopping 19 yards farther each drive, a massive difference in an otherwise close game.
These failed drives in poor field position resulted in short fields for the 49ers and eventually the scores which put them over the top. The 49ers offense was by no means great against the Giants -- the running game was held largely in check and Alex Smith was outclassed by Eli Manning for most of the game. But thanks to field position, the two teams were almost playing on different fields, and that slowly but surely sunk the Giants on Sunday.
San Francisco Wins With Field Position
By
Jack Moore
published on 11/16/2011
in
analysis,
game analysis,
research
Subscribe to:
Post Comments (Atom)


I love the chart! Seeing this chart for more games would be very interesting.
Perhaps you can incorporate some measure of WP by drive.
Semi-related.....Your reference to WP over time uses a horizontal line on the graph. I try to check out all the graphs for games I don't watch to get a feel for a sense of how close the game was. Rather than look at a flat WP benchmark, I eyeball a cone of competitiveness starting at 50/50 with lines going to 100% top and bottom. If the WP is in the cone, it's a game, if not, "time has become a factor."
.
Is field position replicable?
Jack, interesting article. That graph is striking. Don't show it to Coughlin, he'll go ballistic! There were so many special teams penalties on the Giants in that game! One time a Giant's player committed two different penalties on a niner player in a kickoff.
Would be interesting to see some descriptive WPA/EPA stats for special teams in the advanced box scores.
Jack: Awesome analysis! I had a suspicion a lot of the Niners' success was due to field position -- seems like we've been playing with a short field all year -- and your objective analysis confirms it.
Anonymous: Aspects of field position are replicable. For example, for all the talk of Akers' FGs, his ability to bang the ball through the back of the end zone for a touchback is just as important. The latter is definitely a skill.
Ian: I actually think networks should experiment with a dedicted Coughling Cam just to catch his profane and apoplectic reactions, lol.
I would be curious to see if/how average field position (or some other measure, maybe average field position ratio for/against) correlates with winning.
Steveo, I believe the research shows field position correlates strongly with winning. As I recall, the relationship is extremely linear.
According to the drive stats compiled at Football Outsiders:
San Francisco's offense has the league's best starting field position league: 32.5 yardline
New York is 29th: 25.6 yardline
Similarly, San Francisco's defense has the second-best starting field position. Opponents start at the 24.5 yardline.
New York is 22nd: 28.7 yardline.
http://www.footballoutsiders.com/stats/drivestats