Air Yards 2008

Trying to measure individual performance in football is nearly impossible. Perhaps kickers are the only players whose performance we can isolate from the rest of his team. The position in a distant second might be the quarterback. But measuring QB performance with statistics is still very problematic. Consider this tale of two QBs.

One quarterback led his team to a 12-4 regular season record after starting slow at 3-3. He won the Associated Press's MVP award. Another quarterback was replaced due to ineffectiveness early in the season by an aging journeyman best known for headbutting a stadium wall. Which one would you want on your team? You wouldn't be able to tell from their official stats.

Although one didn't play the entire season, both passers had nearly identical "per attempt stats." The first QB threw for 7.2 yards per attempt and the second QB threw for 7.1. They both had a 95 NFL passer rating. Actually, Tavaris Jackson's was 95.4 and Peyton Manning's was 95. But then again, I might be able to approach a 95 rating if I were throwing dump-offs to Adrian Peterson.

If football were a brand new invention, and we had to decide how to credit the various amounts of yards gained to various players, how would we do it? If I said, "There's this kind of play called a pass, in which a thrower passes the ball to a another player who then runs with it as far as he can. I say we credit all the yards run by the receiver to the thrower," you'd say I was nuts.

I'd say, "Well, it takes a special kind of talent for a passer to get a lot of yardage after the catch (YAC). I won't be able to prove it, in fact, I won't have any evidence for that statement at all, but I still think our primary measure of a passer should include all those yards." I'd be laughed at.

Here are the QBs from 2007 who led the league in percent of their passing yardage as YAC: Croyle, Testaverde, Greise, Harrington, Favre, McCown, Losman, and Lemon. The 2006 list includes Brunell, Carr, Favre, (Rob) Johnson, and (Alex) Smith. There's isn't a single guy on that list who we can call a legitimate starter.

The 2008 season's list of leaders in %YAC include Cassel, O'Sullivan, Campbell, Favre (again), Losman, and Wallace. But Matt Cassel is good, right? Maybe not. Keep in mind how good the team around him was. He was handed the keys to a Ferrari. If a QB racks up his passing yards with YAC, he's either throwing lots of short check-downs and screens, or he has spectacular receivers--or both. Neither is necessarily an indication of a particularly skilled passer.

If we throw away all the YAC and look underneath, what do we have left? I call it Air Yards (AY). It's the distance forward of the line of scrimmage a pass travels. Although it's not a perfect measure of a passer, I think it makes a lot more sense than crediting Donovan McNabb with 71 yards and a touchdown for a 1-yard screen pass to Brian Westbrook.

To be clear, I'm not claiming that a QB has absolutely zero contribution to YAC. The QB has to complete the pass for there to be any YAC in the first place. It's just that the majority of credit assignable between the QB and receiver is due to the receiver. (Much of it can be attributed to the defense and to random variation). Plus, there are better ways of crediting the QB for a completion. Looking at Air Yards at least tells us a lot about a QB that we wouldn't otherwise know. I might be throwing a little of the signal out with the bathwater, but the remaining signal-to-noise ratio is hopefully much better.

Here is how the 2008 regular season Air Yard stats break out. Click on the table headers to sort.


RankNameTeamYds YACYAC%AY/Att
1Delhomme32881269394.9
2Ryan34401404414.7
3Rivers40091840464.5
4Rodgers40381652414.5
5Pennington36531546424.4
6Rosenfels1431664464.4
7Cutler45261881424.3
8Manning P40021627414.3
9Manning E32381220384.2
10Brees50692398474.2
11Romo34481578464.2
12Schaub30431470484.1
13Roethlisberger33011368414.1
14Warner45832173474.0
15Hill2046895444.0
16Garrard36201494414.0
17Garcia27121248463.9
18Edwards26991266473.8
19Orlovsky1616652403.8
20Frerotte21571023473.8
21Jackson1056502483.7
22McNabb39161805463.7
23Hasselbeck1216451373.7
24O'Sullivan1678887533.6
25Flacco29711433483.6
26Thigpen26081101423.6
27Russell24231143473.5
28Collins26761292483.3
29Orton29721450493.3
30Favre34721779513.2
31Quinn518230443.2
32Wallace1532755493.2
33Griese1073488453.2
34Anderson1615724453.1
35Bulger27201336493.1
36Campbell32451686523.1
37Cassel36932116573.1
38Palmer731358492.9
39Fitzpatrick1905848452.8
40Losman584294502.8

Division Round Playoff Probabilities

Last weekend the consensus favorites went 2 for 4 while the model here went 3 for 4. But this week there are no surprises as all four of the consensus favorites are favored here as well.

The game probabilities are based on team performance for all games since week 9, with the exception of week 17 when some teams played at less than full strength.


PwinGAMEPwin
0.42 BAL at TEN 0.58
0.18 ARI at CAR 0.82
0.41 PHI at NYG 0.59
0.30 SD at PIT 0.70


Probabilities based on the complete regular season would be:
BAL at TEN, 0.41 to 0.59
ARI at CAR, 0.17 to 0.83
PHI at NYG, 0.50 to 0.50
SD at PIT, 0.37 to 0.63

Check back soon for the full Super Bowl probabilities.

Single-Point-Failure Model of the Passing Game

Baseball has long been considered the easiest of professional sports to model and analyze mathematically. It’s certainly far simpler than football. One reason baseball is easier to model is that the sport isn’t really a team sport, at least in the most mechanical sense. It’s an orderly series of one-on-one match-ups between pitchers and hitters. Fielding and base-running certainly matter at the margins, but it’s the pitcher-batter interaction that dominates most outcomes.

In contrast, every football play seems like a desperate, chaotic scramble of 22 players. Where baseball is a series system, football is more of a parallel one. In a very simplified way, much of a football play can be modeled as several simultaneous one-on-one match-ups. Take a simple pass play. Each pass blocker matches-up with a pass rusher, a back picks up a blitz or dog, and each receiver matches-up with a pass defender. (At least this would be the case with a man-on man pass defense. Zone defenses can be thought of in a very similar way as I’ll describe below.)

This kind of system is similar to a chain. If any one link fails, the entire system fails. No matter how well the other offensive lineman are blocking, if one lineman misses his block there’s probably going to be a sack. And if one pass defender blows his assignment, either by being beat in man-to-man or being in the wrong place in a zone, there’s a good chance for a big pass completion. This is why a football play can be thought of as a “point-failure” system.

Just like each player has a batting average, each offensive lineman could have a core probability of allowing a pass rusher to beat him and either pressure or sack the quarterback. Likewise, each pass rusher has a core probability of beating a blocker and getting to the QB. These baseline probabilities could be very low, but because it only takes 1 of the 5 pass rushers to be successful on any given play, the resulting chance of a hurry or sack grows considerably.

This is why having a world-class, Hall-of-Fame worthy tackle might not mean that much for a team’s overall pass protection, especially if there are weak blockers elsewhere on the same line. The math works out so that it’s better to have a line full of average blockers rather than a line of one all-pro and four slightly below-average colleagues.

For simplicity’s sake, say each pass rusher has a 5% chance of beating his blocker (within the likely time period before the throw). With 5 pass rushers on a pass play, the chance of any one of them getting to the QB would be 1 – (1-0.05)5), which is 0.23. So in this very simple model, the chance of any 1 of the 5 pass rushers hurrying, hitting, or sacking the QB would be 23%.

The receiver-defender match-ups would work similarly. Say there is a 5% chance a pass defender will either be beaten man-on-man or blow his zone assignment. It only takes one blown assignment for a failure to occur. No matter how well the other members of the secondary are doing, a single failure can lead to a big pass. With four defensive backs in coverage, this would put the overall chance of a wide open receiver at 1-(1-0.05)4) = 0.19.

So, in a very simple way, a passing play is like two chains under strain. One chain is the pass protection, and the other is the pass defense. Each link is a player vs. player match-up, and it has its own probability of breaking based on the abilities of the respective players. The first chain to break loses.

Can you imagine a football team with a starting player who is a point-failure in nearly every play? He'd be a lineman who always gets beat by a pass-rusher or a defensive back who always gets beat by a receiver. It would be ugly. Can you imagine any sport where this could be the case every game? Consider the National League, where pitchers are nearly always an easy out. In baseball, the failure of a pitcher at the plate is confined to his at bat.

So far, I’ve left out the most important player. The quarterback has to see open receivers and throw accurately to make big plays. He has maneuver in the pocket, and scramble from pass rushers. The QB is a big wildcard in my chain analogy.

I imagine this is how football video games like Madden are modeled, at least at the core. The game designers need to know what probabilities of allowing a pass rusher to beat a blocker should be to yield a realistic sack rate. Just looking at sacks alone, we can estimate a ballpark individual “sack allowed” rate is for individual linemen. Overall, the NFL sack rate is about 6.5%, so to solve for the baseline individual rate we can say:

6.5% = 1-(1-x)5
-whole bunch of algebra-
x= 1.1%

Remember that’s an extremely rough figure because there are lots of other factors to consider, such as overload blitzes that linemen can’t handle or don’t control, or quick out passes that allow almost no chance of a sack. Plus we’re only counting sacks, not hits or hurries. So I’m only demonstrating a process, not declaring an answer, or even claiming there is a worthwhile answer. With such a low baseline rate and the NFL’s small sample sizes, it would be difficult in the extreme to grade a lineman purely statistically.

I'm only offering this analysis as a way of thinking about the sport. The only conclusion I’ll draw is a simple one. Ask yourself which is stronger, a chain with 10 links, or a chain of 20 links? It’s the shorter chain. If each link has a certain chance of breaking, you’d want the one with the fewest links.

Offensive passing systems that are heavy on multiple-receiver sets have a mathematical advantage. The more pass defense match-ups and the fewer the pass-rush match-ups an offense can create, the better. An offense would generally want the pass-rush match-ups to be the like the chain with fewer links, and the pass-defense match-ups to be the chain with more links. This way, there is a greater chance of a single point failure in the secondary and a lesser chance of one in the offensive line.

Again, I'm not proposing any sort of statistic to grade individual players. I'm just stepping back and examining why football is sometimes called the ultimate team sport.

Wildcard Game Notes

Wow. Good match-ups and exciting games all weekend.

Arizona 30 Atlanta 24

I had the Falcons as the much stronger team going into this game. A Matt Ryan TD pass going into halftime gave Atlanta the upper hand, but a botched hand-off by the rookie QB early in the 3rd quarter handed the Cardinals a touchdown. It was a freakish play to say the least, and it turned out to be the difference in the game.

Part of the key for Arizona was its pass protection. Warner wasn't sacked once. Don't be fooled that the Cardinals have all of a sudden found a running game. They gained 3.1 yards per rush. I figure they'll be big underdogs going into Carolina next week.

San Diego 23 Indianapolis 17

I had San Diego highly rated all year and as the favorite in this game, so I'm happy to be vindicated. They appeared to be the stronger all-around team. The Chargers had 26 first downs compared to 17 for the Colts. But 6 of the Chargers' first downs were from overtime when Indy didn't get to touch the ball. (More on that below.)

The Colts seemed to have the game completely in hand. Up by 3, with 7 minutes left in the 4th quarter, Indy had a 1st and 10 from the Chargers 46 yard line. Normally, this gives a team about a 90% chance of winning. A field goal is only a pass or two away, and a touchdown is fairly likely. Either one would have put SD in a desperate situation.

Instead, the Colts were flagged for holding, eventually leading to a 4th and 21. The ensuing field position battle gave the ball back to the Colts on their own 1. They were forced to punt, and SD got the ball and basically started the game-tying drive already within FG range. Tony Dungy, plus several analysts, are crediting SD punter Mike Scifres as the difference in the game. But that holding call on the Chargers 46 was truly pivotal.

Traffic for my site is through the roof since Saturday. A lot of it is coming from Indiana looking for how often the coin-flip winner is victorious in OT. Long time premium subscriber 'Borat' and I were discussing this after the game Saturday. I pointed out that the 'lose the coin flip never touch the ball' scenario happens 30% of the time. He countered and said, that means it doesn't happen 70% of the time, so what's the big deal? Plus, the other team has the chance to make a stop on defense.

So I said, let's play 1 on 1 basketball for a hundred bucks. First person to make a basket wins...oh, and I'll start with the ball. (You do have the chance to make a stop...)

The reality is the NFL OT rules gives far too much advantage to the coin flip winner. This is partly an unintentional consequence of the rule change that moved the kick-off line from the 35 to the 30. An easy fix would be to move the OT kick-off back to the 35, which would drastically increase touchbacks and greatly reduce the advantage.

Baltimore 27 Miami 9

The Ravens dominated this game. A lot has been made of Joe Flacco's steady calmness and Baltimore's new-found offensive mojo. And true to form, Flacco had zero sacks and zero interceptions. But after the game I couldn't believe what I saw when I looked at his line in the box score: Flacco was 9 for 23 (39% completion) with a 59 NFL passer rating. So it was the defense that again won for Baltimore.

Ed Reed is a freak. He had two interceptions to add to his 9 regular season picks, one for a 60-yard TD return. It was his late-2nd quarter TD that gave Baltimore the upper-hand in the game for good.

Freak isn't exactly a proper scientific term. Perhaps I should say 'outlier.' My research last off-season strongly suggested that defensive interceptions were not consistent within a season. They appeared to have everything to do with 1) randomness, and 2) who was passing, and not with the defense on the field. Baltimore and Reed are making me re-think this. It could be that 90% of defenses are at the mercy of the passer, but there can be a few outliers that do have a knack for generating takeaways. I'll have to dig deeper into the data on this.

Philadelphia 26 Minnesota 14

This was a very close game except for a single play. The score was 16-14 for what seemed like all game until a 71-yard TD reception by Brian Westbrook with 6 minutes to go in the 4th quarter. It was an incredible effort by the entire Eagles offense. The downfield blocking was unbelievable, by both the o-line and both wide receivers.

This is the kind of stat that irks me, however. McNabb gets credit for a 71-yard TD pass, but it was a simple screen any practice-squad QB could throw. The combination of Westbrook's speed and the team's blocking is what broke open the game. In reality, it was a zero-yard pass, essentially a glorified lateral, and a 71-yd run. I think it's time for me to revisit the Air Yards concept.

Looking forward to this Saturday.

Weekly Roundup

If you don't read Carl Bialik's two columns at wsj.com, you should check them out. Twice a day he offers up interesting takes on things numbers and sports related. The Numbers Guy is a column on the intersection of topical subjects (often sports) and math. The Daily Fix is a daily wrap-up of interesting sports stories. Often his posts are estimates of "how unlikely was that?" (I contributed to his "How unlikely was the Steelers-Chargers 11-10 score?" article.)

This week his columns focus on football, and the playoffs in particular. Bialik notes how various sports prognosticators can go from awful to great in one year. I think this is more evidence that these guys don't know anything that the rest of us don't. They're just guessing or extrapolating the present. And they're wasting their time.

Bialik looks how unlikely that all four home teams are underdogs for the wildcard round this weekend. He also looks at how historic the Dolphins turnaround was this year.

Phil Birnbaum also chimes in on the same subject, linking to Bialik's post. He also beats me to my own punch by citing the fact that last year my system had the Dolphin's pegged as a far better team than their 1-15 record indicated, and so their turnaround may have about as much to do with luck as other factors.

The PFR Blog has a fact-filled post on the history of the NFL's playoff tie-breaking methods and which ones are most predictive of which teams will actually be successful in the playoffs. I'm not sure the sample sizes are big enough for such an analysis, but I do have a couple opinions on what methods are best.

To me, the head-to-head tie breaker is probably the most fair, or at least the most acceptable. Although one team will have enjoyed home field advantage if the head-to-head match-up was an inter-division game, at least we can say it was "settled on the field." One commenter noted that in the current system, an NFC team's victory over the Lions would be more valuable than an inter-conference victory over the Titans. That's why I'd suggest a very simple strength-of-schedule tie breaking system.

Say two or more teams are tied at 10-6 for a wildcard. A simple and fair way to break the tie would be to ask how hard were those 10 wins to come by. We could just add up the total number of wins of each of the two team's opponents, common or not, and whoever had the tougher schedule gets the playoff berth.

Football Outsiders looks at whether older quarterbacks underperform in the cold months of the season. They don't, at least according to their analysis, which is based on fantasy points. I think the more interesting thing is that QB performance, regardless of age, doesn't fall off very much at all in the winter months.

Smart Football has a good philosophical post about what is "real" football. Pounding the rock out of the I-formation all game long, right? No, says Chris. It's all arbitrary, and the rules have been changed so many times that there's no such thing as real football anyway.

I tend to agree. When I was doing research for a post about the extra point, I was fascinated by how the rules of American football evolved from rugby and even soccer. Back in the late 19th century, when football as we know it began, college teams from the northeast were constantly squabbling over which rules to use--"football" rules with a line of scrimmage, or standard rugby rules. Often the same teams would play a game with one set of rules in the morning, then another with the other rules in the afternoon!

Establishing the Run? 2

A few days ago I posted a look at whether run gains increased the more often a team runs. In other words, does running more frequently wear down a defense and allow longer runs later in the game?

My analysis was pretty straight-forward. I numbered each team's run in each game, then plotted the average gain of every first run, second run,...20th run in a game. There was no increase in the average gain with later runs, and so I took this as evidence that frequent runs do not fatigue defenses and contribute to longer gains. What I should have said is I failed to find evidence to that effect.

Commenters had a lot of pushback on my conclusions, and for good reason. Among the criticisms were:

1. Late-game meaningless runs to run out the clock by teams with large leads will tend to be short because defenses expect runs.
2. Late-game runs within field goal range might be short for similar reasons. If a team only needs 3 points to tie or win, they'll almost always run the ball to avoid an interception, and defenses know this.
3. Average gain doesn't tell the whole story. It's helpful, but it's just one number.

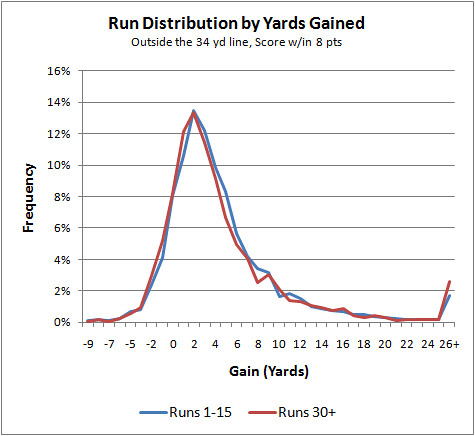
So I did a few more things. I limited the data to runs when the score was within 8 points--a single score. I also limited the data to runs from outside field goal range, defined as the 34 yard line.

Also, instead of looking at average gains according to which run it was for each team in a game, I created a histogram. For those not familiar, it's a frequency plot of how often runs go for each amount of yardage. Knowing the average is good, and median might be better, but the full distribution can tell us much more of the whole story.

I grouped the runs into two sets of interest. The first set is each team's first 15 runs of a game, and the second set is for each team's 30th and later runs. If there are noticeably more instances of longer gains for the later runs, then we can say we have evidence for the run-fatigue theory.

Data is from league-wide regular season runs from 2000 through 2007.

There are far games with run attempts of 30 or more than games with up to 15 attempts, so I normalized the distributions. Each distribution is plotted as a percentage of the total in each group. For example, we'd read the graph by saying about 13% of runs 1-15 are for 2 yards. The same is true for runs 30+.


I won't make any inferences--for now. I'll just make some observations and let others draw their own conclusions. Please share your thoughts with comments.

The distributions are nearly identical, except in two places. The first place is kind of a quirk just short of 10 yards of gain. (There is an anomaly of NFL stat-keeping at 10 yards. If the ball passes 3 yard markers, it's a 3-yard gain. If it passes 4, it's a 4-yard gain, and so on, except for when the ball is within a yard of a 1st down. On 1st and 10, you can pass 10 yard markers and still only be credited with a 9-yard gain if the nose of the ball doesn't get past the first-down marker. Since 10 yards to go is by far the most common to go distance, the effect of the anomaly will be most pronounced short of 10-yard gains, making 9-yard gains more common.) Because there are far fewer late runs than early runs, the late runs are statistically more susceptible to this quirk.

The second difference is more relevant. Since there are so few gains beyond 25 yards, I grouped gains beyond that distance together. That's where the little up-tick is at the right end of the graph. Additionally, keep in mind that many, if not most, very long runs are touchdowns and are truncated by the goal line. An 70-yard run from an offense's own 30 could very well have been a 90-yard run had the line of scrimmage been a the 10 yard line.

There's a very slight advantage for the late runs. It's statistically significant, but extremely small--about 2.2% vs. 1.8% of runs beyond 25 yards. The significance, however, is possible only because the sample sizes are huge (n=33,952 for early runs and n=2,536 for late runs).

Wildcard Game Probabilities

Arizona started 7-3 then lost 4 of their last 6 games to finish 9-7. Baltimore started the season 2-3, then reeled off 8 wins in their last 11 games to finish 11-5. The Colts were 3-3 before their 9-1 run to finish 12-4. Philadelphia's post-season hopes were dim at 5-5-1 before winning 4 of their last 5 games to sneak into the playoffs. Miami was 2-4 at one point this year. San Diego was 4-8.

A lot of what we see with these turnarounds and winning streaks can be explained by opponent strength and random bunching of wins and losses, but not all of it. Teams can fundamentally improve and decline, most often due to injuries. There are many other factors too.

Matt Ryan and Joe Flacco are not the same players they were the 2nd week of September. The Wildcat offense isn't the novelty it was in week 1. And Peyton Manning's knee is no longer the swelling ball of fluid it was in September. So for my playoff probabilities this year, I'm going to base all the calculations on the most recent 8 games for each team.

I'll also provide the probabilities based on the full regular season stats for comparison.


PwinGAMEPwin
0.74 ATL at ARI 0.26
0.43 IND at SD 0.57
0.52 BAL at MIA 0.48
0.62 PHI at MIN 0.38


Full-season stats produce the following probabilities: ATL over ARI 0.63 to 0.37. SD over IND by 0.65 to 0.35. MIA edges BAL 0.56 to 0.44. And PHI over MIN by 0.67 to 0.33.

Edit: Probabilities based on stats excluding week 17 games are in the comments below.

Playoff Team Efficiency Comparison

Here is a handy comparison of the efficiency stats for the current playoff teams. Last year, I found myself referring to this chart myself several times.

O Pass, D Run, etc. is in yards per attempt. O Int, and D Int are the percent of pass attempts resulting in an interception. O Fum Rate is fumbles per offensive play (all fumbles, not just fumbles lost). Pen is penalty yards per all plays.

Click on the table headers to sort.


TEAMOPASSORUNOINTRATEOFUMRATEDPASSDRUNDINTRATEPENRATE
ARI7.13.50.0240.0286.54.00.0250.39
ATL7.44.40.0250.0156.04.90.0180.29
BAL6.04.00.0280.0255.13.60.0490.40
CAR7.34.80.0290.0145.74.40.0220.32
IND6.83.40.0210.0105.94.20.0310.32
MIA7.04.20.0140.0176.24.20.0330.34
MIN6.04.50.0380.0286.03.30.0230.35
NYG6.15.00.0200.0175.84.00.0340.42
PHI6.24.00.0260.0155.13.50.0290.31
PIT5.93.70.0300.0264.33.30.0380.41
SD7.74.10.0230.0176.34.00.0250.38
TEN6.14.30.0200.0195.23.70.0350.43
NFL Avg6.14.20.0280.0236.24.20.0280.36