
Fangraphs.com, which is best described as the baseball version of this site (actually, the other way around) posted an article today about the luckiest and unluckiest MLB teams at the all-star break.
It's very similar to my own lucky/unlucky breakdown. They're using a simpler runs for/runs against Pythagorean model while I use a logistic regression of efficiency stats. Both systems adjust for opponent strength. I think both are appropriate for the different characteristics of the two sports.
Lucky/Unlucky Baseball Teams
published on 7/14/2009
with
0
comments

In-Game Home Field Advantage
 Last season I discovered something interesting about home field advantage (HFA) in NFL games. It decreases as the game goes on. In terms of points scored by quarter, home teams have the biggest advantage in the 1st quarter, and then their advantage disappears by the end of the game. By the end of regulation, home teams and visiting teams perform equally well.
Although it’s clear that home teams perform better during a game, at least in terms of points scored, it’s not clear exactly how this translates into an increased chance of winning minute by minute. From simple win-loss records, all we know that at the outset of a game the home generally team ultimately has about a 56.5% chance of winning.
So there are (at least) two mechanisms at work. First is the decrease in performance advantage for the home team as the game goes on that I discussed above. Perhaps fatigue neutralizes the home team's edge, or perhaps it's visitor acclimation to a hostile, unfamiliar environment. Second, as the game clock ticks down, there is less time for the home team to capitalize on its advantage. By the end of the game the scoreboard doesn’t care which team is the home team and which is the visitor. A 1-point lead is good enough to win, period. So it’s a complicated thing to model. We just can’t add 6.5% to the win probability (WP) for the home team throughout the game.
But I think I’ve cracked it. Using the WP model, which does not consider HFA, I can chart the average probability that the home team will win as the game goes on. It begins at 50% and by the end of the game it’s 56.5% (which I'll call a "6.5%" advantage).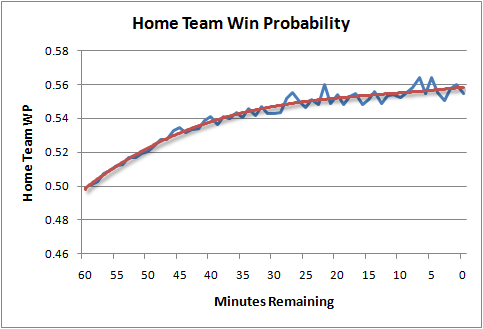
But we know that 6.5% advantage really exists as early as the first kickoff. It’s just that the model is “learning” and discovering that advantage as it actually accrues over the course of the game. So the shape of that curve is the shape of the curve of actual HFA, just in reverse.
Starting with a 6.5% advantage at kickoff, and following the shape of the curve, we see the real, no kidding, actual HFA as the game goes on. This isn’t HFA in terms of yards per play, first downs, or points scored, or in terms of anything except the probability of winning.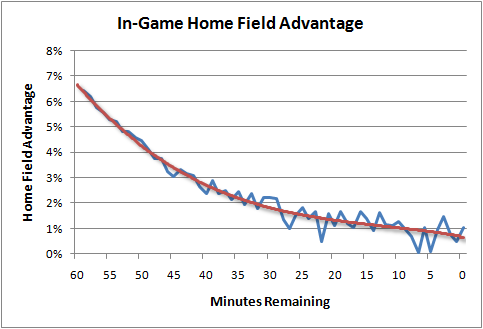
The HFA equation is:%HFA = (-4E-05)t3 + 0.0056t2 - 0.304t + 6.98
Where t is the time in minutes remaining in a game.
This now enables me to feed the strength of the advantage back into the win probability model to properly adjust for HFA. I would have to adjust the home field-agnostic WP with these values logistically (using the log of the odds ratios). This is because HFA would decrease in importance as one team or the other builds a large lead. HFA doesn’t really matter if a team has a 28-0 lead at halftime.
I've intended to include HFA into the WP model for a while, but just didn't know exactly how it declined through the course of the game. Now I know. Thanks to Ian for an insightful comment that got my wheels turning.
published on 7/13/2009
with
14
comments
Win Probability Model Accuracy
 Occasionally I see comments asking about the win probability model's accuracy. The model and the game graphs it creates are useful and entertaining, but only if they're accurate. How do you know I'm not just making up a bunch of nonsense?
For readers who are accustomed to linear regression models, you'd expect to see a goodness-of-fit statistic known as r-squared. And for those familiar with logistic models, you'd expect to see some other measure, such as the percent of cases predicted correctly. But the win probability model I've built is a complex custom-built model, using multiple smoothing and estimation methods. There isn't a handy goodness-of-fit statistic to cite.
We can still test how accurate the model is by measuring the proportion of observations that correctly favor the ultimate winner. For example, if model says the home team has a 0.80 WP, and they go on to win, then the model would be "correct."
But it's not that simple. I don't want the model to be correct 100% of the time when it says a team has a 0.80 WP. I want it to be wrong sometimes. Specifically, in this case I'd want it to be wrong 20% of the time. If so, that's a good feature of any probability model. This is what's known as model calibration.
The graph below illustrates my WP model's calibration. The blue line is what would be the ideal calibration, and the red line is the actual. As you can see, it's nearly perfect. Whenever the model says a team as a 0.25 WP, it goes on to win 25% of the time. And when it says a team has a 0.35 WP, it goes on to win 35% of the time, and so on.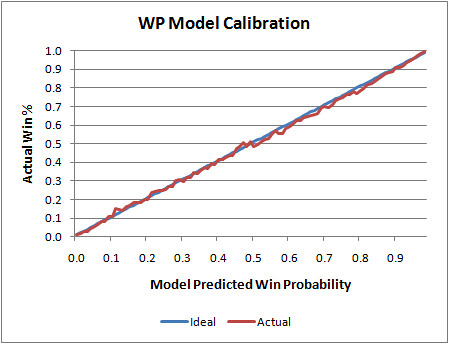
That graph is slightly deceptive, however. The model is essentially "predicting the past." In other words, it's using the same game data it was originally built on to test itself. (There is so much data in the sample, I doubt this is really an issue.) Actually, the model is based on data from the 2000 through 2007 seasons. So here is the model applied to the 2008 season, which was not included in the 'training data.'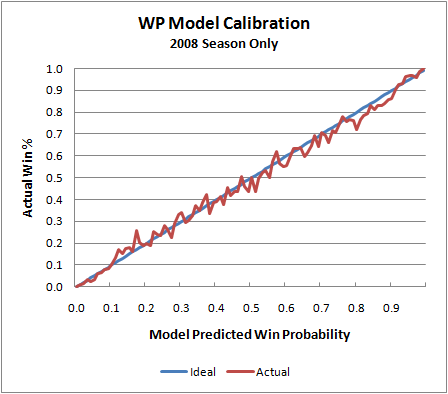
We see the same tight symmetry, which is what we're looking for. Of course, there is naturally more noise because of the smaller sample, but that's completely expected. I do notice that the actual values 'sag' a little toward the upper end of the scale. This may suggest that the model is very slightly (but possibly systematically) undervaluing possession when teams have large leads early in a game or small leads late in a game. That's something worth investigating.
But calibration is only half the story. Consider a WP model that always said each opponent had a 0.50 WP no matter what the score was. Technically, it would be perfectly calibrated. It would end up being correct exactly 50% of the time. So aside from calibration, we'd want a model to be confident. If a model possessed God-like omniscience, it would have 100% confidence as soon as kickoff. Obviously, we can't do that (even for games against the Lions). But as long as the calibration is sound, the higher the model's confidence the better.
Here is a plot of the WP model's confidence by game minutes left. At kickoff, it's a 50/50 proposition, and then as the game unfolds it becomes clearer who has the upper hand. Even in the final minute, it's not totally clear which team will win, and that's part of what's great about the NFL.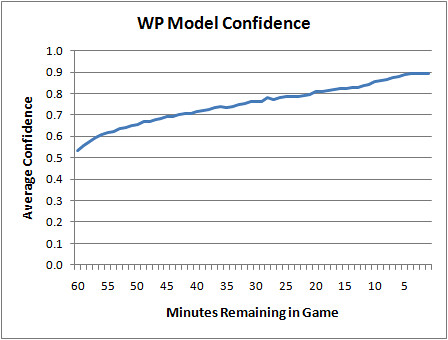
Needless to say, I'm very pleased with these results. But this isn't a testament to clever modeling or brilliant research. It's simply due to the wealth of data I started with. Even so, I'm currently working on major improvements that I hope will be ready for the upcoming season.
published on 7/07/2009
with
8
comments
An Underdog Wins with Aggressive, Risky Football
 No, not that kind of football.
A couple weeks ago I wrote a post about how underdogs can increase their chances of winning by employing a high-risk, high-reward strategy. It seems that’s just what the US soccer team did in their recent upset against the globe's top team, Spain.
According to this analysis by the Journal’s Carl Bialik, the American team uses long aggressive passing, looking for fast-break scores, instead of using a more typical ball control offense. This opens up opportunities for a quick goal, but usually results in the opponent controlling the ball on the US side of the field (or pitch, if you’re a ‘football’ aficionado). As long as the goalie has a good game, and the defense gets some breaks, the strategy works.
It makes sense because the US team has nothing to lose. No one expects them to go very far in World Cup play, so they can afford to use a risky gameplan without being humiliated if they end up losing 4-0.
published on 6/25/2009
with
5
comments
Why There Is So Much Holding
So assuming that a defender that beats his blocker would always sack the quarterback, the blocker should hold him whenever he believes the probability of detection is lower than about 0.81. In other words, he'd get away with it 1 out of 5 times. It's understandable why a blocker would intentionally hold a pass rusher in this situation. The bottom line is that the probability of detection at which committing holding is worthwhile is when it is about 4/5 the chance a pass rusher will get a sack if he beats his blocker. For argument's sake, say that a pass rusher in the backfield gets a sack half the time. The probability of detection would need to be below 0.4 for the hold to make sense. It all boils down to the graph below: So all a blocker needs to do is quickly solve the equation above immediately after the snap, given his estimate of...I'm just kidding. Of course I don't expect anyone to use math to make decisions in the heat of battle, but this analysis does explain one reason why we see so much holding. There are other complicating considerations too. A pass rusher could miss the sack but hurry the pass, causing an incompletion or worse. There are all kinds of possibilities. But ultimately, despite the apparent harshness of the penalty, the infraction is not always called, and in many cases can be worth the cost. Nothing upsets a coach more than a offensive holding call in the middle of an otherwise productive drive. The play, usually a good one, is nullified, and the penalty moves the line of scrimmage back 10 yards. What was a promising 2nd and 5 becomes a difficult 2nd and 15.
Yet holding calls are frequent, which suggests there's obviously something useful about holding. For passing plays, the alternative is often a sack, which is bad in all kinds of ways. Plus, not all instances of holding are called. I'm sure if you polled defensive lineman, they'd say less than 10% of holds are actually flagged.
So I wanted to know, "for passing plays, what's the break-even detection rate for a hold which would make it worthwhile?"
It's a complex question with lots of variables, so let's isolate some. First, let's define the utility of "worthwhile" as based on the probability of converting a first down. Consider a general 2nd down and 5 situation. Typically, an offense in that situation that calls a pass will convert for a 1st down 71% of the time. We'll note this as P1D = 0.71.
An offensive holding penalty negates the play and penalizes 10 yards from the previous spot, forcing a 2nd and 15. That makes the chances of a 1st down considerably lower. The probability of a 1st down "given a hold" is P1D|Hold = 0.20. For all 2nd and 5 pass plays in which there was no sack, the probability of conversion is P1D|NoSack = 0.73. But for all 2nd and 5 plays that resulted in a sack, the probability of conversion is P1D|Sack = 0.30.
In order of preference, you'd rather have neither a sack nor a hold (0.71), then a sack (0.30), and lastly a hold (0.20). But not all holds are called. I'm not sure what the detection rate really is, but we can solve for what detection rate would make a hold worthwhile.
For now, let's assume that if the pass rusher beats his blocker, he will cause a sack 100% of the time. And let's call the ref's holding detection rate "x." The break-even detection rate could be found with a simple linear equation:P1D|Hold(x) + P1D|NoSack(1-x) = P1D|Sack
Solving for x, we get:.20(x) + .73(1-x) = .30
.20(x) + .73 - .73(x) = .30
-.53(x) = -.43
x = .81
But pass rushers who beat their blockers don't sack the QB 100% of the time, so let's generalize the equation. Call the probability of a sack given the defender beats his blocker "y." The break-even equation now becomes:P1D|Hold(x) + P1D|NoSack(1-x) = P1D|Sack(y) + P1D|NoSack(1-y)
Simplifying, we get:.20(x) + .73(1-x) = .30(y) + .73(1-y)
.20(x) + .73 - .73(x) = .30(y) + .73 - .73(y)
-.53(x) = -.43(y)
x = .81(y)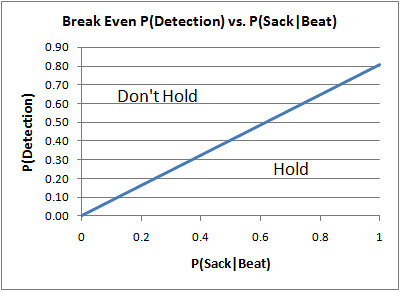
Note: Data is from the 1st quarter of all NFL games 2000-2008. Other quarters are excluded to eliminate the effect of "end-game" plays--hurried plays at the end of the halves, desperation plays by trailing teams, and clock-burning plays by leading teams.
published on 6/24/2009
with
9
comments
Best Games of the Decade
 Now that all NFL games since 2000 have been added to the Win Probability Archive, we can step back and take an inventory of some of the more special games in recent years. I've created a simple search tool for finding many of the most compelling games of the decade.
There are many things that make a game special. Any game with playoff implications is more interesting than one between mediocre teams, and playoff games themselves are obviously critical. But many of those games are just plain boring. They're sometimes duds, decided by the end of the 1st quarter.
I wanted to know what the most exciting games were purely between the sidelines, what were the biggest comebacks, and which teams played the most dramatic football. That's why I created two new indices--Excitement Index (EI) and Comeback Factor (CBF). Admittedly, these stats are purely from a spectator's perspective, and would have very little application to the game itself. But hey, it's fun.
Comeback Factor
The comeback index was easy. For any given game, the 'CBF' is based on the lowest win probability at any point for the ultimate winner. To make bigger comebacks have bigger CBFs, I made CBF be the inverse of the lowest WP.
For example, if a team is down by 10 with 10 minutes left in the 4th quarter, they'd have around a 0.13 WP. This means the trailing team has a 1 in 8 chance of winning, and the CBF is therefore 8. A team that comes back from a 0.01 WP, would have a CBF of 100, the largest possible.
You might be tempted to say that CBF should factor in the lateness of the comeback. Certainly, a comeback in the final minutes is more dramatic than one staged in the 3rd quarter. I agree, however WP already factors that in. A 17-point lead in the 2nd quarter has an equivalent WP as a 2-point lead late in the 4th quarter.
Excitement Index
"Excitement" was harder to measure. Unlike measuring comebacks, there is no single true measure of excitement, and different people can have different definitions. I tested a few different methods, including several suggested by commenters, and ultimately chose a method that I think is both effective and straightforward.
EI is simply the sum of the WP graph's movement throughout a game. That's it. Despite the simplicity, this method captures much of what makes a game interesting. Games with large swings in WP will end up with large EIs, while blow-out games where the WP quickly climbs to 0.95 for one team will have smaller EIs. That same blow-out, but where the trailing team climbs back into contention will have a larger EI. (Credit goes to eje100, JMM, and NeilC for first suggesting similar methods.)
What about measuring closeness? The closeness of a game is obviously an important part of how compelling it is. And EI captures that too. The closer the game is to a 0.50 WP, the more magnified the WP movement becomes for any given play. For example, a 40-yd pass to the 10 yd line when the score is 30-6 is going to move the WP by barely 0.01. But that same play when the score is tied will move the WP by 0.25 or so, depending on the time remaining.
But games with more plays will obviously have a higher WP. Shouldn't EI account for the number of plays by using the average WP movement? I say no. A fast pace helps make a game exciting. Offenses furiously trying to score as quickly as possible is fun to watch. Pace counts. Plus, overtime games would tend to have the most plays, and therefore the higher EIs. And that's what we'd expect from an OT game. If 'sudden death' is anything, it's exciting to watch.
The Best Games
Below is the search tool, and here is its permanent home. Just enter a year, a team, and whether you want to rank games by excitement (EI) or comeback (CBF). Or you can select 'any year' or 'any team' to find the most interesting games for the entire league in any year, or for the entire decade.
The most exciting game of the decade? Would you believe a meaningless 13-10 game in December 2000 between the Bills and Patriots? Neither would I, until I saw the graph. Happy clicking...
published on 6/22/2009
with
23
comments
Final Season Added to the Archive
The 2000 season has now been added to the WP Graph Archive. That's the earliest season for which I have data, so that will be the last addition.
Next up will be a search tool for finding the most exciting games or games with the biggest comebacks, according to team, year, or both (or for the entire decade). I've also done some analysis to judge the accuracy and calibration of the underlying model itself, which I'll publish soon. The initial results are very solid.
published on 6/19/2009
with
0
comments
2001 and 2002 WP Graphs Added
WP Graphs for the 2001 and 2002 seasons are now available. (Check out the Pats dramatic Super Bowl win over St. Louis with the Adam Vinatieri FG in the closing seconds. In actuality, New England had the game in hand throughout the second half, and never had less than a 50% chance of winning since Ty Law's interception return for a TD in the 2nd quarter.)
That brings the archive to all games from 2001-2008. Only one more season to roll out. Also, I'm currently testing a simple search tool to list and rank games by their "excitement index" or "comeback factor." For example, you could list the most exciting games by your favorite team in the decade, or the biggest comebacks by any team in 2008, and so on.
published on 6/15/2009
with
4
comments
Subscribe to:
Posts (Atom)