
 My fifth and final contribution this week to the NY Times Fifth Down Blog is a Q&A with Toni Monkovic. Toni asks me about everything from predictions to win probability to Bill Belichick.
Fifth Down Finale
published on 8/03/2009
with
0
comments

Verducci Follow-Up
 The recent post about the Verducci Effect and Let's Make A Deal didn't elicit the response I was looking for. Reactions ranged from denial to sadness to even anger. I think the game show story hurt more than helped my case of why I think the Verducci Effect is an illusion. And as I said in the original article, I'm not completely certain. But now, after developing my thoughts a little better, I'm more certain than before.
Game shows aside, I'll explain my thought process with an notional example, a mental exercise actually. I'm most interested in the injury aspect of the Verducci Effect, so I'll concentrate on that in this post. The injury rates I'm going to use are created only for clarity, and they are not intended to match the true rates. I'm also going to make some simplifying assumptions to illustrate the broader point. Please keep in mind this example is only intended to demonstrate a concept.
The Example
Assume every MLB pitcher's career lasts exactly 5 years. Also assume that the league-wide injury rate is 1 out of 5 years, defined as however you like--say being on the DL. Also assume that one year out of each pitcher's career can be identified, after the fact, as a "career year," which by definition assures us of two things: no significant injury and an upswing of innings.
Take 200 pitchers and randomly assign a number from 1 through 5 to each of their 5 respective years completely independently. When a 1 comes up, call that an injury year. So far, we've got a 1 in 5 (20%) injury rate across the league. Some pitchers will have multiple injury years, some won't have any, and they are completely independent.
In my head I'm thinking of a table of cards, 200 x 5. For now, the cards are turned up so we can see the numbers 1 through 5. 20% of the cards are 1s--injuries.
Now, take all the "career years" for the pitchers off the table by removing one card from each row, which by definition cannot be an injury year. Let's choose the highest card and remove it. What percentage of cards will now be 1s (injuries)? Before, there were 200 out of 1000 (20%), and now there are the same number of injuries (200) but fewer cards remaining (800). 25% of the remaining years are 1s (injuries). If we now selected a card at random, we'd have a 1 in 4 chance at finding an injury.
Shrink the Sample
Let's do the same exercise but with a sub-sample of 50 pitchers instead of 200. There are still 20% injury years, and if we take each pitcher's known "career year" off the table, 25% of the remaining years will be injury years. Turn over the remaining cards, so you can't see the numbers 1-5. Turn one card face up at random--what are the chances of finding a 1-card (an injury)? It has to be 25%. We started with 250 cards, but there are now 200 cards remaining and 50 of them are injury cards.
Shrink It Again
Repeat the exercise with 10 pitchers. Does this change anything? No. Originally 20% of the cards were injuries, and after removing the career year cards, 25% of those remaining are injuries.
Down to One Player
Now consider a sub-sample of just a single pitcher. Again, turn over all the cards so we can't see the numbers 1-5. There are originally 5 cards on the table, with a probability of 1 in 5 being an injury card. Take away one card, which we know after the fact is not an injury card, leaving 4 cards. Turn one card over--the card dealt immediately following the "career" year. What is the chance it's an injury?
It would be 25%. We had a league-wide injury rate of 20%, but following career/high-inning years we would retrospectively observe a rate of 25%. Even though the injuries were distributed completely at random and completely independently, we'd see a false connection between high-inning years and injuries in subsequent years.
Even a small difference would appear statistically significant with a large data set, but it would be an illusion. The original probability of a year being an injury year was always 20%, but after looking back and removing a year in which we're virtually assured of no injury, we'd see a 25% injury rate.
Try It Yourself If you don't believe me, you can play the game yourself. Shuffle a deck of cards and deal out 4 face up in row. Those 4 cards represent 4 years of a pitcher's career. Every time we see a diamond card, we'll call that an injury year. We'll say the highest non-diamond card is a career/high-inning year. It goes without saying that, on average, 1 in every 4 cards will be a diamond--an injury. That's our true baseline rate.
After dealing the 4 cards, remove the highest non-diamond card and set it aside. Look at the card immediately to the right of the one you removed. What is the probability it is a diamond? If you said 1 in 4 you'd be mistaken. It's 1 in 3. This is the same illusion.
Try it. I did, 78 times and got a diamond on 26 tries--exactly one third (p=0.04 for the sticklers out there). You have to re-shuffle each time for it to be completely random and independent. Also, if the high "career" card is the right-most card, you can either throw out that iteration or loop around to look at the first card. The effect is the same. In fact, just look at how many of the 3 remaining cards are diamonds, and you'll eventually see that it's 1 in 3.
I'm sure there is a name for this, but I don't know it. If anyone is familiar, fill me in. Otherwise, I'm sticking with the Monty Hall Effect. Also, the Verducci Effect may still be real, but it would have to be shown that the observed injury rates significantly exceed the rate predicted by the effect of the illusion.
Maybe I'm wrong, and that's ok. But every time I deal 4 cards and remove 1 non-diamond, I keep seeing diamonds 33% of the time. Just like the Monty Hall game, you probably won't believe it until you try it yourself.
[Edit: I am now completely certain the paradox/illusion exists as I described. However, after a good discussion with commenter Vince (see below), I'm no longer convinced that the way I set up the question applies to how the Verducci Effect is truly applied. In other words, the illusion is real if you set it up the way I did. It's just that strange, and subtle differences exist in how you look at the problem. For example, if in the pitcher example, you removed the first instance of a non-1, you would see a 1 in the following block 20% of the time, just like you'd expect. But if you select the highest number in the row, or if you remove the final non-1, you'd detect a 1 next 25% of the time.]
published on 8/02/2009
with
29
comments
Entropy, Let's Make a Deal, and the Verducci Effect
 Let’s Make a Deal was a 1970s game show, entropy is the second law of thermodynamics, and the Verducci Effect is an injury phenomenon named for a Sports Illustrated reporter. What do they have in common?
In Let's Make a Deal, host Monty Hall would walk the costumed audience, picking contestants on the spot to play various challenges for prizes. The central challenge was a simple game where the contestant had to choose one of three doors. Behind one of the doors was a big prize, such as a brand new Plymouth sedan. But behind the two other doors were gag prizes, such as a donkey.
Sounds simple, right? The contestant starts with 1 in 3 chance of picking the correct door. But then Monty would open one of the doors (but never the one with the real prize) and with two closed doors remaining, ask the contestant if she wanted to switch her choice. She would waffle as the audience screamed “switch!...stay!...switch.”
The answer is intuitively obvious. It doesn’t matter. She has a 1 in 3 chance when she first picked the door, and we already know one of the other two doors doesn’t have the real prize. So whether she switches or not is irrelevant. It’s still 1 in 3.
...And that would be completely wrong.
The real answer is she should always switch. If she stays, she has a 1 in 3 chance of winning, but if she switches she has a 2 in 3 chance of winning. I know, I know. This doesn’t make any sense.
Don’t fight it. It’s true. If the contestant originally picks a gag door, which will happen 2 out of 3 times, Monty has to open the only remaining gag door. In this case, switching always wins. And because this is the case 2/3 of the time, always switching wins 2/3 of the time. (If you don’t believe me, visit this site featuring a simulation of the game. It will tally how many times you win by switching and staying. It’s the only thing that ultimately convinced me. But don’t forget to come back and find out what this has to do with the Verducci Effect.)
Baseball Prospectus defines the Verducci Effect as the phenomenon where young pitchers who have a large increase in workload compared to a previous year tend to get injured or have a decline in subsequent year performance. The concept was first noted by reporter Tom Verducci and further developed by injury guru Will Carroll.
But I'm not sure there really is an effect. First, consider why a young pitcher would have a large increase in workload. He’s probably pitching very well, and by definition he’s certainly healthy all year. Bad or injured pitchers don’t often pitch large numbers of innings.
Now, consider a 3-year span of any pitcher’s career. He’s going to have an up year, a down year, and a year in between. Pitchers also get injured fairly often. There’s a good chance he’ll suffer an injury at some point in that span. Injuries in sports are like entropy, the inevitable reality that all matter and energy in the Universe are trending toward deterioration. Players always start out healthy and then are progressively more likely get injured. Pitchers don’t enter the Major Leagues hurt and gradually get healthier throughout their career. It just doesn’t work that way. Injuries always tend to be more probable in a subsequent year than any prior year. The second year in a 3-year span will have a greater chance of injury than the first, and the third would have a greater chance than the second.
Back to Let’s Make a Deal. Think of that three year span as the three doors. Without a Verducci Effect, the years would each have an equal chance at being an injury year. For the sake of analogy, say it’s a 1 in 3 chance. Now Monty opens one of the doors and shows you a non-injury year. The remaining doors have a significantly increased chance of being identified as an injury year. In this case, it’s a 1 in 2 chance.
I think that’s essentially what Verducci and Carroll did in their analysis. We already know a high workload season can’t be an injury season, therefore subsequent years will retrospectively appear to have higher injury rates. We would normally expect to see injuries in 1 out of 3 years, but we would actually see them 1 out of 2. It’s an illusion.
The analogy isn't perfect. Door one is always the open door without the prize, and there's no switching. Also, unlike a single prize behind one door, injuries can be somewhat independent (or more properly described in probability theory as "with replacement"). That is, a pitcher could be injured in more than just one year. But the Verducci Effect only considers two-year spans, and since one year is always a non-injury year, the analogy holds in this respect.
Ultimately, just like in Monty Hall’s game, the underlying probabilities don’t change at all. Only the chance of finding what we're seeking changes. There was always a 1 in 3 chance that one particular door would contain the prize. That never changes throughout the course of the game. But after identifying a non-prize door, we’ve increased our chances of finding the injury…err…I mean Plymouth.
I hereby name this phenomenon the Monty Hall Effect.
(PS Quite frankly, I’m not entirely confident in this. It’s hard to wrap my head around, and I keep second-guessing my logic. If someone out there, like a quantum physicist maybe, understands this stuff well, please add your two cents.)
Edit: See my comment for an alternate explanation of how the Verducci Effect may be an illusion.
published on 7/31/2009
with
18
comments
Cutler's Potential in Chicago
 In another guest post at the NY Times Fifth Down blog, I took a look at what a Pro-Bowl caliber quarterback can be worth. Specifically, I estimated how many wins a passing game with Cutler's 2008 numbers could typically be expected to add to a new team.
published on 7/26/2009
with
2
comments
Jay Cutler's Interceptions in Context
 In my third installment this week at the Fifth Down Blog, I discuss Jay Cutler's interceptions. Although he threw 18 picks, the second most in the league in 2008, that number is very deceiving.
If you missed the second installment yesterday, don't worry. It was a rerun of my 'Vick is Underrated' article from a few weeks ago.
published on 7/24/2009
with
4
comments
Guest Post at the NY Times 'Fifth Down'
 I'm a guest contributor for the New York Times Fifth Down blog over the next few days. There will be some fresh articles and some older articles updated with new data. Today's post is a look at just how bad pre-season predictions tend to be.
My thanks to Toni Monkovic for the invitation.
published on 7/22/2009
with
2
comments
Michael Turner in 2009
 One of the more popular articles here over the past year or so has been the 'Myth of 370' article that debunked the direct connection between very high carries one season and significant decline the following season. Atlanta running back Michael Turner is at the center of the discussion this year, at least in terms of fantasy production. He had 376 carries in a breakout season, so naturally fans are wondering what to expect from him in 2009.
Judging by some of the discussion out there, I'm worried some people misunderstand what the Myth of 370 article says. What it does not say is that Michael Turner can be counted on this year to match his 17 TDs and 106 yds per game from 2008. In fact, history suggests he won't repeat. What the article does say is that a RB's tendency to decline after a career year is not due to overuse the previous year.
For a RB to have a career year, a lot of things come together all at once. By definition, he's healthy himself. Plus, he's usually at his peak athletically, he has a talented and healthy offensive line, and his opponents tend to be weak at defending the run. Should we expect the stars to align the same way in following year?
Of course not. Linemen come and go or get hurt, opponents change, and lots of other factors change. Chances are most of those factors aren't going to get better, but get worse. This natural process is at the heart of the concept of regression to the mean. To see what I mean, look at the two following graphs based on top RB performances from 2001 through 2008.
The first graph plots RB rushing TDs per game from one year vs. his rushing TDs per game from the following year. A regression line is fit to the data, showing us what we can typically expect from one year to the next. For example, Michael Turner's 1.1 TDs/G from 2008 would typically suggest a 0.8 TD/G output in 2009.
The same effect is present in rushing yards. Turner's 106 Yds/G from 2008 can be expected to tend towards about 85 Yds/G in 2009.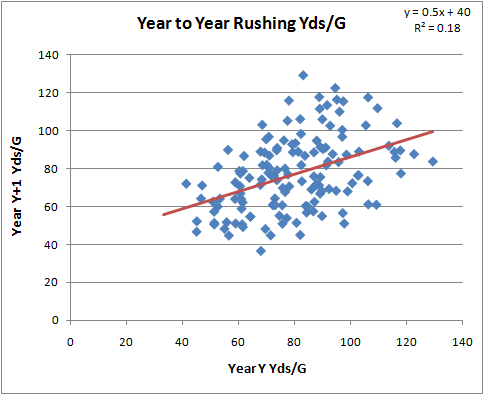
These graphs are presented in terms of 'per game.' Total production is therefore heavily dependent on how many games a player appears in. The top RBs from one year (regardless of the number of carries) tend to play in only 13 out of 16 games the following year. This should also temper anyone's enthusiasm for a repeat year from Michael Turner.
However...these regression effects apply to all RBs, not just Turner. So you shouldn't avoid Turner any more or less than any other top RB in your fantasy draft. Plus, the regression only explains a fraction of the following year's performance. Turner could score 30 TDs or he could score zero. It's all a crap shoot, and I'm only discussing tendencies.
More on regression to the mean and: wide receivers / coaches / turnovers.
published on 7/20/2009
with
3
comments
New Baseball Tracking System
Imagine this adapted for football. It's only a matter of time. Check out the video in the article.
Hat tip--TSE.
published on 7/16/2009
with
0
comments
Subscribe to:
Posts (Atom)