
 The is the fourth and final part of my article on 4th down decisions. In the first part, I reviewed the concept of Expected Points and the concept of expected utility. The second part detailed the kicking game and its expected values. The third part explored the value of 4th down conversion attempts. This, the final part of the article puts all the concepts together. I also discuss some of the explanations for why coaches are so reluctant to go for it when they should.
The 4th Down Study - Part 4
published on 9/16/2009
with
91
comments

The 4th Down Study - Part 3
The is the third part of a four-part article on 4th down decisions. In the first part, I reviewed the concept of Expected Points and the concept of expected utility. The second part detailed the kicking game and its expected values. This, the third part explores the value of 4th down conversion attempts. The final part of the article will put all the concepts together. Ultimately, I'll conclude with a chart of recommended decisions for 4th downs at every combination of field position and distance to go.
published on 9/16/2009
with
26
comments
The 4th Down Study - Part 2
The is the second part of a four-part article on 4th down decisions. In the first part, I reviewed the concept of Expected Points and the concept of expected utility. This part of the article, details the kicking game. The third part will explore the value of 4th down conversion attempts. The final part of the article will put all the concepts together to ultimately produce a chart of recommended decisions for 4th downs at every combination of field position and distance to go.
published on 9/15/2009
with
12
comments
The 4th Down Study - Part 1
If there's one topic where quantitative analysis can change the way football is played, it's 4th down decision-making. Many articles here have chronicled the conservative nature play-calling on 4th down in the modern NFL. In this post I'll explain, as clearly and simply as possible, why the evidence points to a more aggressive attack on 4th down.
Previous studies on 4th down decision-making include Carroll, Palmer, and Thorn's book Hidden Game of Football (1988, 1998) and Professor David Romer's Do Firms Maximize? (2005). The first serious study of the concepts used in these studies was by former NFL quarterback Virgil Carter, who co-authored an operations research paper examining the value of field position using data from the first 56 games of the 1969 season.
My own analysis published in this post largely repeats the methods used in previous studies. But I think I can add a good deal to the topic. First, this analysis is based on a much larger data set compared to previous research. Second, this analysis offers possible confirmation of previous results. Third, I think I can explain a complex, abstract subject such as this in a straightforward manner, which is essential if the 4th down revolution is going to make any headway. Frankly, it doesn't matter how strong the analysis is if it can't be communicated clearly and convincingly.
This is how the study goes: At each yard line, I'll calculate and compare the expected point value, based on recent historical averages, of each of the three 4th down options--punt, field goal, or go for it. The option with the highest value is the recommended choice.
published on 9/15/2009
with
21
comments
Hawks, Doves, and Home Field Advantage
 Sports researchers have been studying home field advantage for decades. It’s a universal phenomenon found in virtually every sport, and professional football is no exception. Home teams win 57% of all regular season games in the NFL. Measuring it is easy. The question is, what causes it?
Several studies have tested theories about crowd noise, referee bias, time zone effects, climate, and peculiarties of ballparks. But these effects have not been shown to account for much if any of HFA.
Some recent research looked at when HFA manifests itself in games. In the NBA, HFA (or HCA rather) is strongest in the beginning of the game and then diminishes as it goes on. I found the same phenomenon in the NFL. The first quarter shows the strongest HFA by far. Now, baseball research reveals the same phenomenon. It’s also been shown that HFA in the NFL is strongest between inter-conference games and weaker between intra-divisional games. With the advent of inter-league play, baseball also appears to have the same tendency.
I think these findings all point toward the same theory, namely that a significant portion of HFA comes from environmental familiarity. I’m not talking about the quirks of an outfield or the type of turf in a stadium. I’m talking about the whole picture—the way we all feel comfortable when we’re in familiar surroundings and often feel anxious in strange places.
I think that game theory can help explain why this is the case. I’m not referring to the usual run-pass or fastball-curve game theory we talk about in sports. Instead, I’m talking about natural selection and behavioral evolution. I realize this sounds a little out-there, but bear with me.
published on 9/12/2009
with
36
comments
Live In-Game Win Probability 2.0
 Live Win Probability graphs are back with tonight's season opener. This year, the graphs have more features, are easier to read, and update much quicker compared to the 2008 version. They feature the new format debuted earlier in the year for NBA and NHL.
For those of you new to the site, here is a primer on what you'll see. The graph charts the probability each team will win the game play by play. The closer the line gets to the top of the graph, the more likely the visiting team will win. The closer it gets to the bottom of the graph, the more likely the home team will win. Think of it as an NFL Richter scale or maybe a cardiogram of a 'football heart attack.'
published on 9/10/2009
with
12
comments
More on the Cost of Interceptions
 In a recent post I looked at the cost of interceptions in terms of equivalent yards and expected points. In this post, I'll look at them in terms of win probability added (WPA).
In a comment on my Fifth Down post regarding the context of Jay Cutler's 2008 interceptions, Will wrote:
"I know you can calculate a change in WP for a given play; this is how you came up with the best plays of the year for last season. Can you also calculate an average change in WP for a type of play? For example, can you find the average change in WP for a Cutler interception vs. a Favre interception vs. the league average, to see who throws more bad picks? I've long felt that many of Favre's interceptions equate to punts, as he throws it up deep on a late-down, long-yardage situation. By the same token, it might be good to know which passers have the highest delta-WP per attempt, or which rushers most change their team's fortunes per rush."
You can read my response in the original post, but I'll expand on it here. Will was getting a little ahead of me because I'm planning on publishing some neat stuff on individual player WPA (win probability added) later this season.
To make things a little easier on myself, I'll cite Bronco and Jet passing game numbers from 2008, not necessarily Cutler and Favre, but I think they're identical for practical purposes. I'll also calculate the league average.
Denver's 18 INTs cost a total of -1.56 WPA (or, in a sense, lost 1.56 games ). That averages to -.087 WPA/INT.
New York's 23 INTs cost a total of -2.49 WPA. That averages to -.108 WPA/INT. You could say that the Jets' interceptions were about 20% more costly than the Broncos' last year.
For reference, there were 465 INTs in the league in 2008, costing a total of -46.98 WPA. That averages to -.101 WPA/INT. So on average, an interception costs a team a 10% chance of winning. An interception equates to 3.8 points, 60 yards, or 10% WP lost.
Interceptions are not typically similar to punts. I've read elsewhere (I think at footballcommentary.com) that interceptions are on average returned to about the line of scrimmage. My data shows something slightly different. Interceptions are on average returned to within 8.1 yds of the original line of scrimmage. Removing the 2nd and 4th quarters from the data to account for Hail Mary interceptions, it's 7.2 yds. So, I suppose you could consider a typical interception like an incomplete pass and then a really, really short punt.
But WPA for any particular interception is dependent on a number of factors. Field position and score are obviously critical, so here is a graph of interception WPA by field position, broken out by selected score differences. Despite the noise in the graph, there are some points to be made.
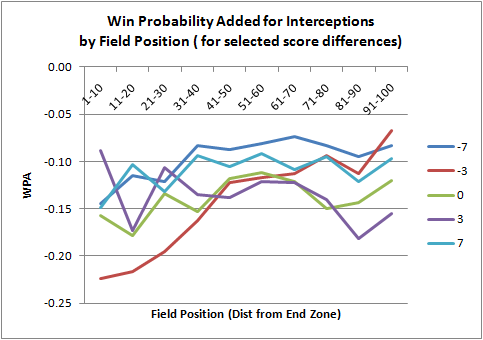
It's interesting how the WPA drops the steepest for when a team is down by 3 points (the red line). Throwing a pick deep in one's own territory when up by 3 points is nearly equally as costly. The bigger the difference in score, whether ahead by a lot or down by lot, the smaller the impact of the interception. The graph makes sense (at least to me)--it's what I'd intuitively expect.
Time is also critical. So here is the same graph, except limited to only 4th quarter interceptions. (WPA is a function of many things--score, time, fld position, down, to go distance--that I can't show everything on a single graph.) It's a little noisier, so I grouped the field position by 20-yard chunks instead of 10.
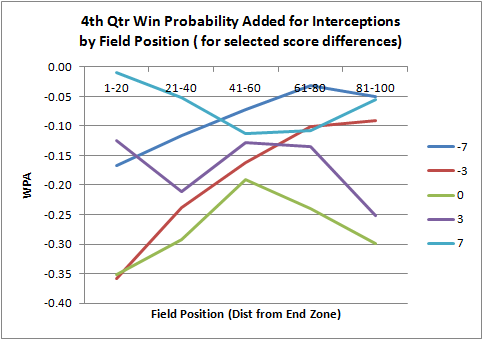
Again, we see what we'd expect. The tighter the score, the more costly the interception. Tied or down by 3 in opponent territory is where they're the costliest.
published on 9/10/2009
with
6
comments
Adjusting Adjusted Yards Per Attempt
 Reader Jeff Clarke sent me an email a few weeks ago asking about the interception yardage value used for the Adjusted Yards Per Attempt (AdjYPA) passing statistic. AdjYPA is total passing yards minus 45 yds for every interception thrown, divided by total attempts. It's a really handy stat because it encapsulates passing performance as a simple, single number, and better still, it's a rate stat.
The 45 yard adjustment number comes from the 1988 book Hidden Game of Football. The authors don't fully explain how they arrived at that figure, but I gather it was based on an analysis based on expected points. They do however, make a good intuitive case for it. An interception can always be thought of as costing any chance at a first down and precluding a punt. Punts net between 35 and 40 yds, and forfeiting a chance of the first down costs and extra few yards, which together comes to about 45 yds. Perfectly reasonable...for 1988.
Fast forward 21 years and the passing game, and offense in general, has become more potent. With offenses being more efficient, the value of having the ball is therefore greater, and turnovers would accordingly be more costly.
Jeff Clarke made a great observation. He wrote,"your own 15 yard line is the point of indifference. Holding everything else neutral, you are indifferent between having the ball at your own 15 and your opponent having it at his 15. Doesn’t this mean that the penalty for throwing an interception on first down should be 70 yards – the distance between the 15s?" (Expected Point curve below).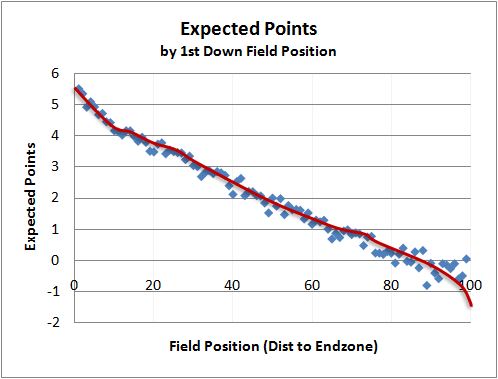
Jeff went on to point out that the cost of an interception would be less on 3rd and 15 than say, 2nd and 1 because the expectation of a first down is different for each situation. Jeff's analysis predicts that the true yardage equivalent would be something shy of 70 yds--the distance between the 15 yd lines. I was convinced to dig a little deeper.
The average difference between interception plays and non-interception passes is 3.81 expected points. This is the weighted average for all plays on 1st, 2nd, and 3rd downs for all yard line. It accounts for return yards, and down & distance situation. I excluded 4th down passes, as those are often thrown in desperation situations, where high levels of risk are acceptable and the cost of the interception is not much different than a simple incomplete pass.
3.81 points equates to approximately 60 yards of field position. The graph below plots it nicely. The green line is the EP for non-interception plays, and the blue line is fit to the EP following interception plays.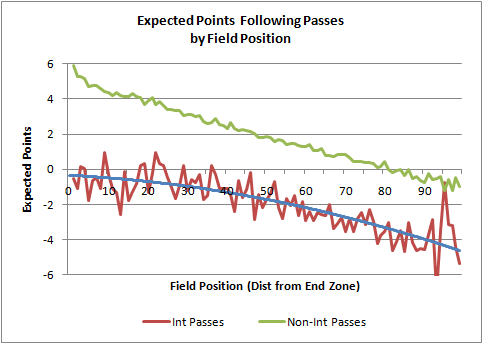
EP is roughly linear away from the end zones. So if we look at the expected points graph for non-interception plays (the green line), +3.8 EP is at the opponent's 20 yd line. And the 0 EP point intersects at a team's own 20 (80 yds from the end zone on my graph). That's a difference of 60 yds.
60 passing yards is the modern interception equivalent of an interception, not 45.
published on 9/09/2009
with
18
comments
Subscribe to:
Posts (Atom)