
 I just implemented several new features and significant upgrades to the Win Probability Calculator tool as well as the model behind it.
1. The biggest new feature is the capability to adjust the WP estimates based on relative team strength. This is accomplished by entering either a pregame WP estimate from the efficiency model, another source, or the game's point spread. The model has had this ability for a long time, but I didn't want to implement it until I had a sound way of doing so.
The prior pregame estimate of WP is revised as the game goes on with the baseline in-game WP estimate. The two probabilities are reconciled using the logit method. The trick is to understand how the pregame difference in team strength decays over the course of the game. At a certain point, it doesn't matter how much a team was favored if it's trailing by two or more scores late in the game. Team strength differential decays proportionally to the log of time as the game progresses according to a particular curve.
Pregame WP or spreads should be with respect to the current offense. For example, if the game's spread was -3 but the visitor has the ball in the scenario you are investigating, enter 3 for the spread. In what is a cool enough feature all by itself, entering a spread will automatically convert into a pregame WP estimate.
For the record, the WPA stats for teams and players will continue to use the baseline unadjusted WP numbers. If we used the adjusted WP numbers, every team and player would have a zero WPA assuming our pregame estimates were accurate. Put simply, using the adjusted WPA stats would defeat their very purpose and only be a measure of how good our pregame forecasts were.
2. The next most significant update is the ability to account for receiving the kickoff in the 2nd half. This can have an effect of up to a 0.04 WP swing in the first half of close games. The input asks users for whether the team with possession kicked off to start the first half or not. This consideration doesn't apply following the 2nd half kickoff, so for 2nd half scenarios you can just leave the input at the default Don't Know.
Win Probability Model/Calculator Upgrades - Team Strength Adjustment & More

Team Efficiency Rankings: Week 13

As you would expect, these types of teams are only fringe contenders, with far too many deficiencies to make a serious Super Bowl run. Of course, we could easily have said that about last season's champs, who look like the favorites to become this year's postseason party crashers.
Podcast Episode 11 - Pete Palmer
Dave interviews Pete Palmer, one of the original great minds in Sabermetrics. Pete co-authored The Hidden Game of Baseball, and later, The Hidden Game of Football. Pete describes how he discovered a scorekeeping error that incorrectly listed Ty Cobb's 1910 batting average as too high, thereby literally rewriting the baseball record books. He then discusses what it was like to edit baseball and football encyclopedias, how he made the move into football analytics and his current role as a member of the New England Patriots statistics team. Pete outlines the major findings he and his co-authors describe in The Hidden Game of Football, including early versions of expected points and win percentages. The show concludes with a discussion of questions he's interested in analyzing in today's NFL.
Subscribe on iTunes and Stitcher
Momentum Part 3: After Failed 4th Down Conversion Attempts

This installment cuts to the chase. From a strategic perspective, we want to understand how momentum may or may not affect the game so that coaches can make better decisions. Often, momentum is cited as a consideration to forgo strategically optimal choices for fear of losing the emotional and psychological edge thought to comprise momentum.
Here's the thinking: If a team tries to convert on 4th down but fails or unsuccessfully tries for a two-point conversion, it gives up the momentum to the other team. The implication is that failing on 4th down means that winning is now less probable than the resulting situation indicates, beyond what the numbers say. Therefore, the WP and Expected Points (EP) models used to estimate the values of the options no longer apply. In a nutshell, the analytic models underestimate the cost of failing.
[By the same token, the reverse argument should be just as valid. Wouldn't succeeding in a momentum-swinging play mean the chances of winning are even higher than the numbers indicate? For now, I'll set the 'upside' argument aside and examine only the 'downside' claim.]
New Feature: The NYT 4th Down Bot

In partnership with the New York Times, I'm pleased to unveil the bane of every football coach in America--The 4th Down Bot. At its heart, it is a real-time application of the 4th Down Calculator feature here at ANS. It uses both the Expected Points model and the Win Probability model to estimate the best option for every 4th down as a game is in progress.
Sunday's Numbers Have Been Crunched

Advanced stat box scores
Top QBs of the week
Top RBs of the week
Top WRs of the week
Top TEs of the week
Top Defenders of the week
Advanced team stats
Offensive player season leaders
Defender season leaders
Team Viz
Position Leaders Viz
QB Viz
RB Viz
Should You Kick a FG on 3rd Down?

Unless you're inside the 10 kicking on 3rd down isn't a good idea. Even a gain of 1 yd improves FG prob more than the chance of a bad snap.
— Brian Burke (@Adv_NFL_Stats) December 2, 2013
Admittedly, I wrote that just based on my familiarity with the relevant numbers, so I thought I'd do the legwork. FG% improves with every yard closer a team gets. Every yard matters. In fact, every yards matters to the tune of 1.6% per yard when the line of scrimmage is between the 35-yard line and the 10-yard line.
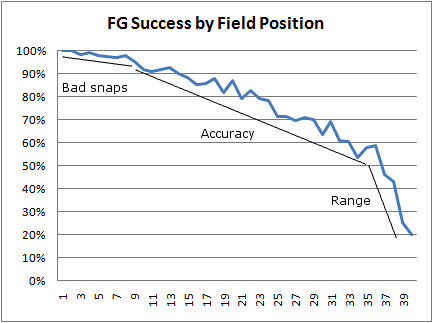
Yesterday, Keith looked at this kind of situation in the context of the CHI-MIN game, and his results suggest the same conclusion. This post will examine play outcomes on 3rd down when the game is on the line and teams are in deep FG (attempt) range, and compare them to the likelihood of a bad snap or hold.
Overtime Field Goal Gaffes Galore
 The Vikings ended up in overtime for the second consecutive week, this time against the Chicago Bears. After a quick Bears' three-and-out, the Vikings drove down field to the Bears 21-yard line. The game is now in sudden death format, so a field goal wins it. Unfortunately, in the NFL there is the myth of field goal range. The summation of that article is in bold at the bottom: "Closer is always better."
I first want to mention that field goal kicking has improved dramatically over the last few years, and the two kickers involved in this game (Robbie Gould and Blair Walsh) are among the very best in the league. The Vikings, facing a 3rd-and-10 from the Bears 21, opted to attempt a 39-yarder rather than try to get closer. For Blair Walsh, this is seen as a gimme. In today's NFL, that is about an 87% proposition. Very likely, although still more than a 1-in-10 chance he misses.