
 This season will be the first that the Baltimore Ravens will start the year without place kicker Matt Stover. Stover has been a reliable fixture for the franchise for its entire existence. He's known for his reliable medium-range accuracy, but his field goal range and, possibly more importantly, his kickoff distance dwindled in recent years. Last year's kickoff specialist Steven Hauschka will now take over as the full-time field goal kicker.
Keeping a kickoff specialist on the roster has become somewhat fashionable in the NFL, but I'm not sure when the trend started or exactly how many teams do it. It's an expensive thing to do, not just in terms of salary, but in terms of a roster spot too. If you've read John Feinstein's Next Man Up, you know how precious every spot is for the coaches, and how difficult the weekly decisions are about who to dress for each game. A kick-off specialist is a costly luxury.
But maybe we're thinking about this backwards. Maybe we should ask whether it's worth it to have a field goal specialist.
Assessing FG Accuracy
It's been shown here and elsewhere that FG kickers are very hard to tell apart from one another. I have no doubt that it takes great skill and countless hours of dedication be as good as NFL kickers are. However, almost all kickers at the professional level can be considered statistically as accurate as any other.
By "statistically accurate" I mean that accounting for small sample size, environmental variables, and attempt distance, it is virtually impossible to tell one kicker apart from another. A kicker who is highly accurate one year is not likely to be as accurate the next. A big part of this variability in accuracy can be attributed to what's known as 'sample error.'
Typically, NFL FG kickers have between 30 and 40 attempts in a season. Think of baseball batters' averages after only 40 at bats, which would be about 8-10 games into the season. By this point some replacement-level guys are batting .500, and some future Hall of Fame sluggers are batting .100. But absolutely no one thinks the batters are truly .500 or .100 hitters. It's just a matter of a small statistical sample, which makes it impossible to really assess individual batting skill. And if batting had a wrinkle similar to FG attempt distance, it would be even harder to assess skill.
To me, it's absolutely laughable that some teams' kicker jobs are decided by pre-season contests based on maybe 4 or 5 attempts per kicker. I can only hope that coaches are really making these decisions based on many more attempts in practice.
The point is that we need dozens and dozens of attempts, from various distances and in various conditions, just to begin to be able to tell one FG kicker apart from another. And I bet that if we actually could tell good kickers from lesser ones, a very large part of the difference would be due to range.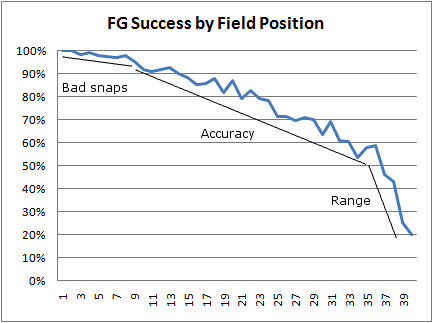
So if range is important to both kinds of kicks, wouldn't a team prefer the guy with the deeper kickoffs? Plus, range is something we can actually measure. I can't definitively prove my point of view in a single post, but I can begin to look at some aspects of the value of deep kickoffs. In this post, I'll look at the value of something I think is often overlooked: the touchback.
The Value of a Touchback
About 10% of all NFL kickoffs (not including onside kicks) are touchbacks. Forcing the opponent to start at their own 20 doesn't exactly seem like a death blow, but it is modestly valuable.
The average starting position following all kickoffs (including penalties on the play) is the 30 yd line. But the average starting position for all non-touchback kickoffs is the 32. The difference between a touchback an non-touchback is 12 yds. If the 32 seems a little far down the field to you (like it does to me), it's because the median starting field position for non-touchbacks is the 27 yd line.
Here is the distribution of starting field position for non-touchback kicks.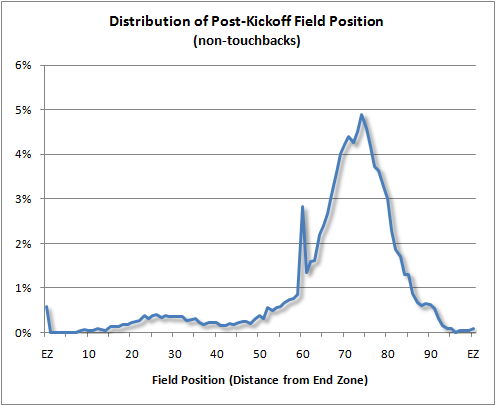
[A couple of interesting notes. First, the spike at the 60 (a team's own 40 yd line) is from kicks out of bounds. Second, I think it's interesting that of long returns, there are many more that make it to the opponent's 30 or 20 or so than make it only to just past midfield. Then, if a returner makes it past the 20, he's probably going to make it all the way to the end zone.]
Back to touchbacks. Using the concept of Expected Points (EP), the average point value of a first down at each field position(see graph below), we can estimate the nominal value of a touchback. The 20 yd line represents 0.1 EP, and the weighted average of the distribution of non-touchback field position is 0.9 EP. That's a value of 0.8 EP per touchback. (This includes turnovers and penalties.)
Sacks are worth 1.7 EP, so a touchback could be considered the equivalent of about half a sack.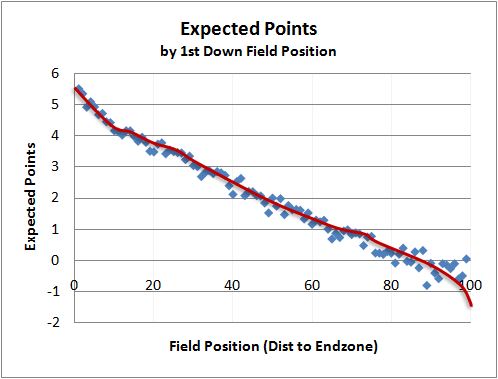
An alternative way of thinking of those 12 yards is to think of them as one additional first down required for a team to score. It's one more first down the offense will need to either score a TD or get into FG range. The average first down conversion rate in the NFL is 67%, so a touchback turns a TD drive into a FG drive or a FG drive into a punt 33% of the time.
We can also use the concept of win probability to asses the value of a touchback. Over the past 9 seasons, non-touchback kicks average a change of 0.002 in WP. Touchback kicks average an increase of 0.01 WP. The net value of a touchback is therefore an increase in 0.008 WP, or about 1%. One percent isn't much at all, but with about 5 kickoffs per game for each team, the effect can add up.
The WP added (WPA) of any given kickoff depends on the leverage of its particular game situation. With the game close and time dwindling, a touchback or deep kick can make a 2-minute offense that much harder for the offense.
The biggest two touchbacks in my database (going back to 2000) were each for 0.13 WPA. Kicker Steve Lindsay, who played only two seasons in the NFL, was picked up by Denver from Jacksonville halfway through the 2000 season. With the Broncos Trailing 37-31 to the Chargers and 4:05 left in the 4th quarter, Lindsay boomed the touchback heard 'round the world (not exactly--but it should have been.) Field position in this situation was critical. A FG by San Diego would have clinched the game, and Denver needed the ball back in as good field position as possible. As fate would have it, the Broncos went on to win the game 38-37.
Arizona kicker Neil Rackers owns the other touchback of the decade. In a 2007 game against Seattle, tied 20-20 with 4:53 remaining in the 4th, Rackers' touchback made it that much more difficult for the Seahawks to put together a game-winning drive, and would have made Arizona's own drive that much easier. What actually happened was that Seattle fumbled on a 1st and 5 from the Arizona 36, allowing the Cards to put together a FG drive to win the game. Sure, the game turned on a turnover and not field position, but had Seattle found itself on the Arizona 24 and not the 36, maybe the play call would have been a little safer. We'll never know.
Anyway, those are my two nominations for the touchback hall of fame. It's not the most glamorous play in football, but it's certainly overlooked and worthy of examination.
The Value of a Touchback

Worst 4th Down Decision of 2008
 Last November, the Eagles and Bengals were both desperately trying not to win. And they both succeeded, as their game was the first to end in a tie in several years. It's hard to forget that game thanks to Donovan McNabb's comment that he was preparing for a second overtime period.
McNabb's comment aside, the game was remarkable in that it featured not one, but two of the most timid 4th down decisions in the 2008 season. In both cases, had the offense gone for the first down, it would have significantly improved its chances of winning. Note I'm not saying simply that a successful conversion would have helped the team win. I am saying that on balance, considering the chance of a failed conversion, the far wiser decision would have been to go for it.
With the game tied 13-13 and 1:56 left in the 4th quarter, the Eagles offense faced a 4th and 1 from its own 49-yard line. A punt would have made their WP 0.31. That's lower than you might think at first because handing the ball to the Bengals with two minutes on the clock guaranteed they would not have enough time to respond to a successful Cincinnati scoring drive.
A successful conversion would have given Philadelphia a tremendous advantage. With a 1st down and the ball at midfield, they would only need a few more yards to get into field goal range for the win. Conversion attempts on 4th and 1s are converted about 74% of the time. All things considered, had the Eagles lined up to go for it, their 'expected' WP would have been 0.60. That's a difference of 0.29 compared to the punt--essentially doubling their chance of winning. In terms of costing a team in its likelihood of winning, this was the single worst 4th down decision of the 2008 season.
The Eagles may not have possessed the NFL's best power running game last year, and that 4th and 1 may have been a "long" 1 yard. But to make a decisive difference, the particular details of the situation must have been so overwhelmingly disadvantageous that it's hard to believe. It's not as though the Bengals defensive line was an impenetrable brick wall, and the Eagles did successfully convert 3rd and 1s 60% of the time in 2008, a task not much different than 4th and 1. Further, we can solve for the break-even conversion success rate. In this case, the Eagles would have needed to convert just 5% of the time for the attempt to be worthwhile.
I know what you might be thinking. Wouldn't a failed attempt at the 50 give the Bengals the identical situation that a successful attempt would give the Eagles? True, but don't forget the alternative: punting gives the Bengals the upper hand anyway.
Fortunately for the Eagles, the reason they even had the opportunity to consider a 4th down and 1 was thanks to the 13th worst 4th down decision of 2008. Cincinnati punted on the previous drive when a successful 4th down conversion would have given them a firm upper hand.
Coaches talk a lot about "momentum" when it comes to 4th down decisions. A failed 4th down attempt deflates a team and encourages the opponent. Although teams might feel that way, however, it's not clear at all this makes much difference in terms of who wins. We're talking about professional athletes with plenty of experience at many levels of play.
Besides, think of it this way: Imagine you're a Bengals defender, elated you made a stop on 3rd down while trotting triumphantly off the field. Then you realize the Eagles are lining up for an easy 4th and 1. Chances are they'll convert, and now you're lining up for a whole new 1st and 10. How's the momentum now?
Live In-Game Win Probability 2.0
 The newest version of the in-game win probability site is going live tonight for the last remaining games of the preseason. You can also see the graphs from Thursday's games. I realize no one cares who actually wins any of these games, but I'd like to test it out before the real games begin. Please leave any comments or bugs on this post. A few notes below:
-For now, play descriptions aren't available until after the week's games are over. But if you hover over the graph, you'll see the down,distance, yard line, and score at the time of the play. Full play descriptions, like I have in the archive, will be my next addition.
-Some of the extra advanced stats, including 1st down probability, current expected points, and scoring probabilities are off line for now. I'll bring them back very soon.
-The WP model underneath hasn't changed, but I am working on a major upgrade to it. I like the model now, but it's very noisy and there are some situations on which it relies on sparse data. The new improvements will drastically reduce the noise, which will make the WPA estimates for smaller plays much more accurate.
-The new graphs are flash based, which are not mobile-friendly. I intend to continue the ajax/javascript version which is suited well for iPhones and Blackberries.
As always, it's wp.advancednflstats.com.
Media Requests
The most enjoyable aspect of running this site is sharing what I've learned. To that end, I've had a lot of fun doing appearances on radio and tv, and even podcasts over the past several years. I'm always up for a call-in appearance on sports talk radio.
I also enjoy helping answer questions from print journalists on any topic. I frequently get requests to dig into the stats on a particular question or generate some interesting numbers for an article.
Contact me at hatch113@yahoo.com and put the words 'media request' in the subject line. I can usually respond very quickly.
Decision Theory in Football
 In Decision Theory, there are generally two kinds of analysis. Descriptive analysis is what people actually do, and prescriptive analysis is what people should do. Rarely are the two things the same. For example, when I use the win probability model to evaluate 4th down decisions, I'm doing prescriptive analysis. Trying to explain whatever the heck coaches are actually doing would be descriptive analysis.
To be fair, coaches are not computers. They are subject to all the imperfections of human decision making. In this post, I'll examine some of the ways that coaches may be making decisions, including minimax, minimax-regret, prospect theory, and expected utility. I'll also discuss the potential for how much of a difference a pure prescriptive analysis can make when applied in real games.
NFL Orthodoxy
NFL football has evolved as extremely conservative game. By that I mean that coaches adhere to the wisdom passed down from previous generations and are reluctant to deviate from the established orthodoxy. In the real world, away from sports, this approach usually makes sense. Unlike sports, the world is not bounded by sidelines, end zones, and 15-minute quarters. It is highly uncertain and far less predictable than we'd like to think. It makes sense to adhere to what is known to work rather than try to engineer an optimized outcome in a highly uncertain environment.
But in football, we have the stats. We know the probabilities. And we know the possible consequences. 'Conservative,' as I defined it, is therefore often not the best approach. I think the reason that so many coaches adhere to the same orthodoxy, whether in terms of playbooks or 4th down doctrine, is because they aren't conscious of the level of certainty available to them.
Minimax
One of the more conservative approaches is the minimax criterion. Minimax says pick the option that assures you the highest minimum utility. Let's say you have the choice between going on a picnic and going bowling. You'd really rather go on the picnic, but it might rain. Your payoff matrix would look like this:
No Rain
Rain
Picnic 4 0 Bowling 1 1
If it doesn't rain, the picnic pays off, but if it rains you've lost the afternoon. Bowling is not as much fun as the picnic, but it wouldn't matter if it rains. Minimax says go bowling because 1 is its minimum payoff while 0 is the minimum payoff for the picnic.
Minimax-Regret
Another decision method is known as the minimax-regret criterion. This method seeks to minimize potential regrets. Imagine coming out of the bowling alley and being greeted by a sunny blue sky. 'Darn. Should have gone on the picnic.' In this case, if you go bowling and it doesn't rain, you've gained 1 unit of utility but lost out on 4 units, for a net regret of 3. If you go on the picnic and it does rain, you've gained 0 utility but lost out on 1 unit, for a net regret of 1. If you want to minimize your regret, you'd choose the picnic.
Notice that I haven't mentioned the weather forecast yet. These methods are best relied upon when there is a very high level of uncertainty in the "states of nature" that will determine the payoffs.
Now consider a football example. Say a coach has three plays that make sense for a given situation, and the opposing defense can call one of three kinds of defenses. An example payoff matrix might look something like this:
Def X
Def Y
Def Z
Play A
-4 4 12 Play B
-2 3 8 Play C
3 2 1
Note that this is not game theory. We're not looking for a Nash equilibrium. The offensive coordinator is thinking of the defense as a "state of nature." It's something he has no control over and is difficult to predict.
In this case, both Plays A and B have the possibility of negative payoffs. Play C guarantees at least a payoff of 1, and therefore would be the minimax decision.
The regret method says something different. Assume the defense had called Def X. The best payoff possible given Def X would be 3 with Play C, so had we called Play C there would be no regret. But had we called Play B, we would have earned a -2 payoff, which equates to a regret of -5. In other words, we could have had 3, but we got -2. And had we called Play A, we would have earned a -4, which is a regret of -7.
If we repeat the regret calculation for each possible defense, we get a whole new regret matrix:
Def X
Def Y
Def Z
Play A
-7 0
0 Play B
-5 -2
-4 Play C
0 -2 -11
Given this regret matrix, the minimax-regret criterion would look for the choice that assures us of the best worst-case scenario. For Play A, the worst regret is -7. For Play B, it is -5. And for Play C, it's -11. Therefore, we'd pick Play B because it is the least costly in terms of maximum possible regret.
Of course, coaches or anyone else would never actually draw up a matrix and do the math to make a decision. But just like in the picnic-bowling example, our brains are attempting poor analog versions of these kinds of decision criteria, and emotions play a large role.
Expected Utility
What if we reduce the uncertainty in the defense? We can't predict exactly which one we'll see, but we can estimate the probabilities that we can expect each defense. The expected utility of a choice is the weighted average of the possible payoffs. For simplicity, say each defense is equally likely with a 1 in 3 chance. Now we can estimate the expected utility for each play choice. In the example above, the expected utility for Play A is (1/3)(-4) + (1/3)(4) + (1/3)(12) = 4. The expected utility for Play B is 3, and for Play C it's 2. The expected utility method therefore says Play A is the best choice.
The three methods each call for a different decision. Each method is logical and consistent in its own way, but there is only one truly correct method in football, only one prescriptive analysis. Remember, in football we can know the probabilities and the payoffs, or at least have a solid league-wide baseline for them. The expected utility method is the only correct method.
The math behind expect utility analysis couldn't be any easier. It's 5th grade arithmetic. The challenge is knowing the utility function. Yards, and even points, don't equate to utility. A 7-yard gain is usually good, but it's relatively useless on 3rd and 8. And a 3-point field goal doesn't help late in the 4th quarter when down by 7.
Fortunately, there is win probability (WP). WP is the one and only correct utility function for any game, including football. Winning is all that matters, whether by 1 point or 100 points. WP is also perfectly linear, which is essential to valid expected utility analysis. A 0.40 WP is exactly twice as good as a 0.20 WP, and 0.80 WP is twice as good as 0.40 WP.
Prospect Theory
But even if coaches were to somehow use expected WP analysis when making decisions (say by using 'quick reference' cards like they sometimes do for 2-point conversion decisions), it's likely they still wouldn't be very rational.
Prospect theory says that people fear losses more than they value equivalent gains. Humans evolved with a tendency to try to avoid loss. We're usually more upset with ourselves when we misplace a $20 bill than we are happy when one falls out of the laundry. This tendency has been borne out time and time again in clinical experiments and other studies.
In football, this means that decisions are warped because coaches would fear a loss in WP more than an equivalent gain in WP. The chart below illustrates this concept. According to prospect theory, the "joy" from a 0.05 gain in WP is less than the "pain" from a 0.05 loss in WP.

This asymmetry would affect tactical decisions in many ways, but the most obvious may be 4th down doctrine. Say a team finds itself in a situation where punting would result in a 0.50 WP, but the expected utility analysis says going for the conversion would result in a net 0.55 WP. If the goal is to win the game, the correct decision in this case is to go for it. Period.
The analysis isn't so straightforward for the coach (even if he could do all the math on the spot). Say the failed conversion results in a 0.45 WP and the successful conversion results in a 0.65 WP. A 50% chance at successful 4th down conversion therefore results in a net 0.55 WP.
But the coach sees the 0.45 WP as a possible loss of 0.05 WP, and he sees the 0.65 as a gain of 0.15 WP. Because he fears the loss far more than he values the potential gain, even one 3 times as large, he'll prefer the sure-thing option and punt.
Further, it's possible to actually measure the risk aversion of coaches by comparing the WP advantages in situations where they went for the conversion to the WP advatanges in situations where they forego the conversion attempt.
An Advantage
The coach who can resist this human tendency and make decisions based purely on expected utility will have an advantage. Just how big an advantage, no one can ever know. Actually, that's not true--I'll tell you right now. Just by following a pure expected utility analysis on 4th down, a coach would win an average of an extra 1.4 games per year.
I calculated this based on a play-by-play database from the past 9 seaons. For each 4th down in which a team kicked either a FG attempt or punt, I calculated the difference between going for it and kicking. Wherever the difference was positive, I summed the increase in WP for going for it. The grand total for nearly 2400 games was +203.1 WP, which equates to an increase of 0.17 WP for every game. But since there are always two teams competing in every game, this means that we need to halve that, which is 0.086. The bottom line is that a pure expected utility approach to 4th down decisions would increase a team's chances of winning a game from 0.50 WP to about 0.59 WP. This is equivalent to an extra 1.4 wins per season (0.086*16).
That's a bold claim, I realize. But if you trust my WP model, which is really nothing more than a smoothed empirical observation of how often teams actually won in given game situations in real NFL games, then the claim is not so bold. It's not a perfect model, but the errors are unbiased, meaning it overestimates as much as it underestimates.
Still, if a coach only followed the expected utility recommendations when the WP for going for it was greater than 0.05 more than the WP for kicking, his team would still benefit by an extra 0.8 wins per season. That's nothing to sneeze at in a 16-game season.
Recent Contributions
It can be an interesting exercise to answer questions for reporters and bloggers. Sometimes their questions get me thinking about things in ways I hadn't thought of, or questioning my own assumptions.
Here are a few recent articles from around the web that I've answered questions for:
Rotosavants.com asked me about injury predictions and why I'm so skeptical about them.
The Wall Street Journal did short blurb on how many dollars per wins Eli Manning's new contract might be worth.
Here is a really neat article by Sam Arbesman in the Boston Globe about the concept of clock management in football. As a thought exercise, Sam proposes the addition of a "Time In," which is essentially an anti-time out. It gets you thinking about how important every few seconds are in a close game. I'm kind of a fan of some of Sam's other articles too. My favorite is this one, a suggestion of how to gain immortality in the name of a mathematical constant.
Last month, I did a radio interview with a Chicago station about my Jay Cutler articles.
Koko Fantasy Rankings - Defense
 Last but not least are Koko the Monkey's team defense rankings. In case you aren't familiar with the Koko rankings, they are the simplest projections possible based on previous-year performance. These are intended to serve as the baseline for the bare-minimum accuracy we should expect from all other fantasy projections. A full explanation can be found in the write-up for the QB rankings.
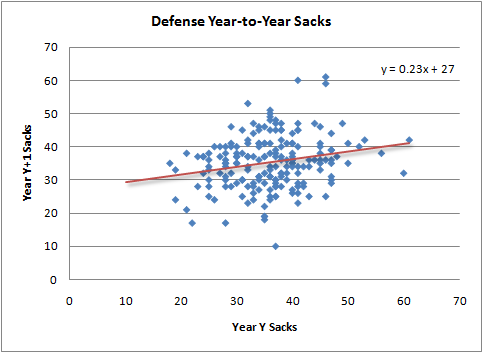
Defense point totals can vary widely depending on your league's scoring rules. For these rankings, I used turnovers, sacks, defensive TDs, and points allowed. Year-to-year correlations for turnovers and defensive TDs are extremely weak, but sacks and points allowed can be projected relatively well. I ignored special teams-based scoring, which should not have any effect on the rankings, as special teams stats are notoriously random and unpredictable.
Here are how sacks and points allowed regress in case anyone is curious.
Here are the final rankings. Regarding fantasy scoring for points allowed, every league is different. I didn't do the math required to estimate how many times a team with a given point average would fall into the various scoring "bins." Instead, I looked at my own league and saw they (very) roughly assign half a point for every point allowed below league-average, which is about 20 pts. So that's what I did here.Rank Defense Sks/G Ints/G Fum/G Pts Allwd/G TDs/G Pts/G Total 1 PIT 2.4 1.0 0.7 18.7 0.16 7.4 118.8 2 TEN 2.3 1.0 0.7 19.0 0.16 7.2 115.3 3 BAL 2.2 1.1 0.7 19.2 0.16 7.0 112.4 4 PHI 2.4 1.0 0.7 20.1 0.16 6.6 105.7 5 NYG 2.3 1.0 0.7 20.3 0.16 6.5 103.9 6 IND 2.1 1.0 0.7 20.3 0.16 6.3 100.0 7 MIA 2.3 1.0 0.7 20.8 0.16 6.2 99.6 8 WAS 2.0 1.0 0.7 20.3 0.16 6.2 98.6 9 NE 2.1 1.0 0.7 20.6 0.16 6.1 98.2 10 MIN 2.3 1.0 0.7 21.1 0.16 6.1 96.8 11 TB 2.1 1.0 0.7 20.9 0.16 6.1 96.8 12 CAR 2.2 1.0 0.7 21.0 0.16 6.0 95.7 13 ATL 2.2 1.0 0.7 20.9 0.16 6.0 95.3 14 DAL 2.5 1.0 0.7 21.8 0.16 5.9 93.7 15 NYJ 2.3 1.0 0.7 21.6 0.16 5.8 92.3 16 CHI 2.1 1.0 0.7 21.5 0.16 5.7 91.9 17 SD 2.1 1.0 0.7 21.4 0.16 5.7 91.1 18 BUF 2.0 1.0 0.7 21.3 0.16 5.6 90.1 19 CLE 1.9 1.0 0.7 21.5 0.16 5.6 89.6 20 JAX 2.1 1.0 0.7 21.8 0.16 5.5 87.5 21 GB 2.1 1.0 0.7 22.1 0.16 5.4 86.5 22 OAK 2.1 1.0 0.7 22.3 0.16 5.3 85.1 23 SF 2.1 1.0 0.7 22.1 0.16 5.3 85.1 24 CIN 1.9 1.0 0.7 21.8 0.16 5.3 85.1 25 SEA 2.2 1.0 0.7 22.4 0.16 5.2 83.8 26 NO 2.1 1.0 0.7 22.4 0.16 5.2 83.1 27 HOU 2.0 1.0 0.7 22.4 0.16 5.1 81.7 28 ARI 2.1 1.0 0.7 23.1 0.16 4.9 77.7 29 DEN 2.1 0.9 0.7 23.6 0.16 4.5 71.4 30 STL 2.1 1.0 0.7 24.0 0.16 4.4 70.6 31 KC 1.8 1.0 0.7 23.4 0.16 4.4 70.5 32 DET 2.1 0.9 0.7 25.1 0.16 3.8 60.0
Koko Fantasy Rankings - Kickers
 The rankings everyone's been waiting for--kickers. Koko the fantasy football monkey is making his way through each position. In case you aren't familiar with the Koko rankings, they are the simplest projections possible based on previous-year performance. The rankings are intended to serve as the baseline for the bare-minimum accuracy we should expect from all other fantasy projections. A full explanation can be found in the write-up for the QB rankings.
Kickers are highly unpredictable, both in real terms and in fantasy terms. In fact, there is no year-to-year correlation in the fantasy points gained by field goal kicking. But there is some consistency in extra points, which has nothing to do with kicking skill and everything to do with the rest of the kicker's team.
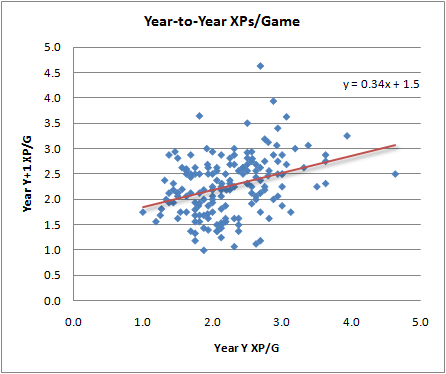
With that in mind, Koko has ranked his kickers based on XPs alone. The bottom line is that kickers are generally interchangeable. Treat the kicker as a position you'll want to swap out later in the year once you get an idea of who's kicking a lot of FGs. For example, look at which teams have good defenses but can't put the ball in the end zone.
One result of relying only on XPs is that we're only interested in team TDs. Therefore, if a kicker is replaced on a team, Koko's projection remains for new kicker on that team. For example, Steve Houshka is replacing Matt Stover in Baltimore. His projection is what Stover's would have been had he remained on the team. To be honest, I'm not closely watching kicker news, so if there are other examples, or if there are guys on here who will be on the IR or out of a job, let me know.Player XP/G FG Pts/G Pts/G Proj Pts John Kasay 2.5 5.2 7.7 115.1 Mason Crosby 2.5 5.2 7.7 115.1 Nate Kaeding 2.5 5.2 7.7 115.1 David Akers 2.5 5.2 7.7 114.8 Neil Rackers 2.4 5.2 7.6 114.5 Adam Vinatieri 2.4 5.2 7.6 114.2 Jason Elam 2.4 5.2 7.6 113.9 Nick Folk 2.4 5.2 7.6 113.9 Jay Feely 2.4 5.2 7.6 113.7 Steven Houshka 2.4 5.2 7.6 113.5 Robbie Gould 2.4 5.2 7.6 113.5 Garrett Hartley 2.4 5.2 7.6 113.4 Dan Carpenter 2.3 5.2 7.5 113.2 Rob Bironas 2.3 5.2 7.5 113.2 Ryan Longwell 2.3 5.2 7.5 113.2 Stephen Gostkowski 2.3 5.2 7.5 113.2 Matt Prater 2.3 5.2 7.5 112.9 Kris Brown 2.3 5.2 7.5 112.3 Jeff Reed 2.3 5.2 7.5 112.0 Matt Bryant 2.2 5.2 7.4 111.6 Joe Nedney 2.2 5.2 7.4 111.3 Rian Lindell 2.2 5.2 7.4 111.3 Josh Scobee 2.2 5.2 7.4 111.0 Olindo Mare 2.1 5.2 7.3 110.0 Jason Hanson 2.0 5.2 7.2 108.5 Sebastian Janikowski 2.0 5.2 7.2 108.5 Shaun Suisham 2.0 5.2 7.2 108.5 Josh Brown 1.9 5.2 7.1 106.5 Phil Dawson 1.9 5.2 7.1 106.2 Shayne Graham 1.9 5.2 7.1 106.0