
 I've been waiting for a good opportunity to write this article for a while. Recently, Carl Bialik at the WSJ asked me to take a look at some punting stats for a post on the 'Golden Age of Punting.' For the last few years, Shane Lechler has been lauded for his super-human punting ability. For three of the last six years he's led the league in total punting yards, and for five of the last seven years he's lead the league in yards per punt. He'll be going to his fourth pro-bowl in a few weeks.
But, there's a problem with all those gaudy stats. Lechler has the benefit of playing for the Oakland Raiders, who for the last few seasons have fielded a terrible offense. Lechler, more than most other punters, gets to punt from deep in his own territory where the chance of a touchback doesn't shorten punts. We can call this the JaMarcus Effect.
In this post, I'll look at where Lechler's average field position is compared to the rest of the league. We'll see that this has a big effect on punt distances. But we'll also see that I'm wrong about Lechler in the end. Despite this unfair advantage, he's still the NFL's best.
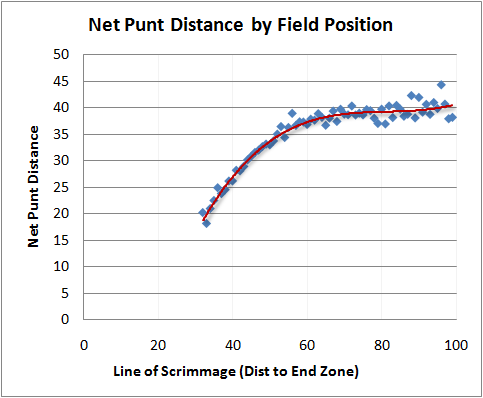
In the NFL this year, the average field position for punts has been a team's own 35.2 yard line. Oakland, however, sports an average of their own 31.2-yard line, the deepest of all 32 teams. Lechler's net punt average is top in the league at 43.6 yds/punt. But for all teams, the correlation between average punt field position and average net punt distance is -0.45, meaning the deeper your field position the longer the punt. It's no wonder Lechler tops the league most years. Below is a graph of expected net punt distance by field position to illustrate what I mean.
But...
Accounting for the JaMarcus Effect, Lechler is still the best. Using Expected Points Added (EPA) and Win Probability Added (WPA) we can compare the expected value of a punter's kicks with the actual values. In other words, if we know how many Expected Points each of Lechler's punts should gain, and he exceeds that, then we can say he's good. We can compare all punters this way, and see who really had the best season. WPA can tell us which punter really made the biggest contribution to his team when it mattered most.
I'm going to look at average EPA per punt and total season WPA. I think a 'per punt' stat is most useful because obviously some punters are going to have more opportunities than others. But for WPA, which measures impact on a game, I think a 'total' stat is more appropriate.
As it turns out, Shane Lechler is number one in both average EPA and total WPA. Below is a table of all 32 teams and their punting stats--Average EPA, total WPA, average field position for punts, and average net punt distance.
I broke them out by team rather than punter because it's about 1,000 times easier with my data set. But this highlights an important point. We're really looking at total team punting performance, not just the individual kicker. (Also, if someone is burning to know the stats for specific guy in the cases where a team changed punters mid-season, let me know. I'll generate the numbers.)
Congratulations Mr. Lechler, you just made the Advanced NFL Stats All-WPA team! (Psst. Your agent can reach me at 703-555-...)
| Punter | EPA Avg | WPA Sum | Avg YL (own) | Avg Net |
| OAK | 0.25 | 0.64 | 31.2 | 43.6 |
| BLT | 0.22 | -0.33 | 36.7 | 39.9 |
| DAL | 0.22 | 0.35 | 36.8 | 41.1 |
| HST | 0.20 | 0.04 | 36.4 | 38.4 |
| NO | 0.15 | -0.16 | 37.2 | 37.1 |
| SEA | 0.15 | 0.28 | 33.0 | 40.5 |
| KC | 0.14 | 0.47 | 34.8 | 40.9 |
| SL | 0.13 | 0.10 | 36.1 | 41.4 |
| ARZ | 0.12 | 0.64 | 36.4 | 39.7 |
| SF | 0.09 | 0.51 | 32.0 | 39.6 |
| ATL | 0.06 | -0.26 | 35.8 | 36.6 |
| NYJ | 0.04 | 0.22 | 36.2 | 37.3 |
| BUF | 0.03 | 0.55 | 33.3 | 40.4 |
| NE | 0.03 | -0.28 | 39.7 | 33.7 |
| SD | 0.02 | -0.21 | 34.7 | 39.8 |
| MIN | 0.00 | -0.40 | 35.8 | 39.2 |
| CLV | -0.01 | 0.52 | 37.5 | 38.0 |
| MIA | -0.03 | 0.01 | 33.7 | 39.2 |
| DEN | -0.05 | -0.59 | 35.6 | 37.4 |
| CAR | -0.06 | -0.21 | 35.4 | 36.0 |
| JAX | -0.06 | 0.14 | 34.4 | 38.9 |
| NYG | -0.07 | -0.36 | 35.8 | 36.6 |
| DET | -0.08 | 0.03 | 33.7 | 36.8 |
| IND | -0.09 | 0.05 | 35.2 | 37.2 |
| PIT | -0.10 | -0.14 | 38.0 | 37.2 |
| CHI | -0.13 | 0.10 | 34.4 | 38.1 |
| PHI | -0.15 | -0.19 | 34.7 | 36.0 |
| TEN | -0.15 | 0.06 | 33.1 | 37.7 |
| TB | -0.17 | -0.23 | 35.0 | 36.1 |
| CIN | -0.22 | -0.09 | 34.5 | 37.1 |
| WAS | -0.23 | -0.50 | 36.5 | 36.1 |
| GB | -0.25 | -0.91 | 35.5 | 34.2 |


Accounting for the crappiness of a team is always so frustrating. During the Heisman race I was always rooting for Toby Gerhart, but a lot of my friends from Pennsylvania were pulling for Dion Lewis, pointing to his 1799 yards. Of course he's got 1799 yards, he's Pitt's only decent running back! You put the ball in a guy's hands four times more often than the next three running backs combined and he's bound to rack up yards.
Interesting how WPA and EPA only have a correlation of .53. I thought it would be higher. Does it imply that quite a few kickers kick better and worse when the game is on the line?
Did you isolate the effects of coaching decisions on punting WPA? In earlier articles, this site has made a case that choosing to punt in certain game situations is not the optimal choice and may lower the team's win probability. Therefore, it seems certain punters would already be at a disadvantage because of a game decision that has nothing to do with their punting ability.
Very nice article, as usual.
Colts is 9th worst in EPA(-0.09), but 14th in WPA (0.05). They is quite average in YL (number 17). How can that be?
Joe-I'm surprised the correlation is that high. WPA can be erratic. One really bad or really good play in a very high-leverage situation can dominate a bunch of smaller plays in the final total.
Jake-Thanks. These numbers all assume conventional coaching decisions--punts outside the 35, field goals inside the 35. If a coach happens to punt inside the 35, it doesn't matter that much because the EP values between FGs and punts are break-even in that region of the field. So no, punters are not penalized for sub-optimum coaching decisions. Punts are only compared to other punts, and not to conversion attempts.
Martin-See my comment to Joe above. A -0.9 EP value translates to about a 1.5-yard/punt difference from the league average. One lesson here is that most teams' punt squads are indistinguishable from one another. All teams are going to have good punt plays and bad punt plays. In the end it's a question of when the good ones and bad ones happen--in a critical situation or when the game is already decided? If I were a GM, I wouldn't use a lot of salary or draft picks specifically for my punting unit.
"Accounting for the crappiness of a team is always so frustrating. During the Heisman race I was always rooting for Toby Gerhart, but a lot of my friends from Pennsylvania were pulling for Dion Lewis, pointing to his 1799 yards. Of course he's got 1799 yards, he's Pitt's only decent running back! You put the ball in a guy's hands four times more often than the next three running backs combined and he's bound to rack up yards."
That reminds me of how people want to put Chris Osgood in the Hall of Fame solely for winning three Stanley Cups and a high number of regular season games...on the Red Wings. Even a mediocre goaltender (by NHL standards) could win a lot of games on the Red Wings.
Jake-I take that back. There may be some contamination with fake punt conversion attempts for some teams. It depends on how I searched for the word 'PUNT' in each play description.
What exactly does the WP for a punt mean? Say a team has a 4th and 3 from their own 40 with a WP of 62%. At that point the 62% assumes an average punt right? So an average punt gives the opponebt the ball with a WP of 38%. But a better net punt might give the opponent only a 37% chance - so the punt gets credit for a 1% gain in WP. Is that how you are measuring this?
I guess what surprised me about the correlation between EPA and WPA was that punts don't seem to have the game changing potential that a last second pass from a QB could have. I mean maybe a punter gets some great 25 yard bounce, or shanks a punt 15 yards, but those are rare. Punters seem pretty much a commodity to me.
Interesting stuff.
I didn't do a good job explaining these stats.
WP for a punt means that the model sees that there is a 4th down outside field goal range and expects the coach to call for a punt. It calculates the expected net punt distance for the given field position of the punt. Then it calculates the WP for current situation (time, score) and the opponent having a first down at the expected resulting field position. Call this WP(avg punt).
The model also calculates the actual resulting WP after the punt. Call this WP(actual punt). The difference in WP between WP (actual punt) minus WP(avg punt) equals WPA.
Deeper punts result in high postive WPA. Shanks would be negative WPA.
WP and WPA are context-sensitive, meaning that WPA is magnified depending on how critical the situation is. Pinning a team on the 1 when the score is close would result in a very high WPA.
Brian,
Thanks - I'm with you on your method.
Slight tangent - but it relates to punting - in a tie game, under what conditions does possessing the ball have a WP < 50%?
It is prolly not linear with time remaining for a fixed yard line. IOW, if I have the ball on my own 5 in a tie game with 3 or more minutes remaining, is that WP < 50%? But if they were just 45 seconds left, the WP > 50% - since for the most part I will win or go to OT.
I'm wondering if you have enough data to calculate when the WP flips for a given yard line.
Joe-I can calculate that, roughly at least. In fact, it's already in the WP model, and just has to be pulled out. But you're right, it's variable depending on time remaining.
But in general, in 'normal football' when time is not a factor, the EP curve crosses zero at a team's own 15 yd line. So at a 1st and 10 on your own 15, you and your opponent are equally likely to score the same amount of points.
I'm a bit curious about the stats of Brett Kern. He was cut by the Denver Broncos after their 6-0 start, and signed by the 0-6 Titans. Of course, the teams' fortunes reversed right then, with the Broncos finishing 2-8 while the Titans finished 8-2. I'm sure Kern had very little to do with this, but I'm curious if he was better than the other Bronco and Titan punters.
Nice piece - I think R^2 would be a better diagnostic than correlation since the relationship is non-linear and correlation only measures linear relationships. It would be nice to see this done as a GLM analysis where you could first factor in the yard line, and then see the effect of adding punter as an additional factor. Then you're essentially answering the question "Given the ball is on the X yard line, which punter is most likely to punt the deepest?"
EPA Average is the wrong stat here.
A kicker who kicks more often from farther away has an advantage in gaining EP value.
In other words, the EP gained needs to be normalized by the EP opportunity. If kicker A is forced to kick from the 50, where the BEST POSSIBLE RESULT is only 0.5 EP better than average (just numbers i'm making up), it is not fair to compare to a kicker who kicks from his own 20 yard line, where the best possible result is 1.5EP.
In short EP is the wrong stat entirely. It is the right stat to measure the team's overall 'value from punting' but wrong for evaluating a player. The player who earned 0.5 EP by kicking from the 50 might earn 1.0 EP by kicking from his 20 instead.
This study does NOT adjust for difference in opportunity properly.
Just to be clear, when I say "The player who earned 0.5 EP by kicking from the 50 might earn 1.0EP by kicking from his 20 instead", I mean 0.5 EP 'above average'.
It is not sufficient to just control for the average and aggregate. There is more opportunity to exceed the average at some field position locations than others.
The same thing holds for any WP analysis.
The above controls for value over average, but does not control for differences in opportunity.
Scott-I see what you're suggesting. Some kicks have a greater opportunity for EP gain or loss then others. So do something like: this kick was +.5 SD given its field position. Another kick was -1.0 SD given its field position, etc. Add them up or average them out to properly normalize.
Scott-What would you suggest for field goals? I am planning to use similar methodology for kickers. So you see a similar issue?
I think Scott is technically correct.
But Lechler's gap over Average YL is only 4 yard - or looking at the graph above - the 69 yards out vs. 65 yard out.
Since that gap doesn't come close to the bend in the curve, I would expect a significant difference in the results that were normalized for opportunity.
I meant "would not expect" in above sentence.
Argh! I just lost a big post. I'll make a few small ones instead.
Part 1:
The sample size is too small to do this, but hypothetically you could build a "profile" for each player --
Expected value per kick as a function of distance.
Players would have different profiles, and you could translate players to other player's contexts:
How valuable would Lechler be if he kicked the same distance distribution as Scifres and vice-versa? What about against the league average kick distribution?
Part 2:
Well, there isn't enough data to do that, but we can bucket punts into a few types. Based on the chart above, there are three regions that make sense to me:
> 65 yards away (long). This is where the graph is flat and the far end zone doesn't come into play often.
> 50 and <=65 yards (medium). This is the 'knuckle' in the graph where the end zone sometimes comes into play.
<= 50 yards (short). This is where kick distance is almost linearly correlated with distance from the end zone.
Within these ranges you could do the same analysis you have already done for each player/team. You can also add the number of opportunities that each player had in each kick type, and the average distance that player was at within each kick distance bucket.
Adding the cumulative standard deviation from the mean for a kicker as you suggest is useful too. It helps weigh each kick chance equally, but still has opportunity bias.
Alternatively, one could attempt to generate an expected kick value profile as a function of distance for each player if you assume or prove that they all ave the same sort of distance curve: linearly correlated with distance from the goal line up until distance A, and constant kick length when farther than distance B.
Then, each punter could be 'rated' based on the four numbers that define that curve.
As I see it, this opportunity problem is similar to Place Kickers.
In each case, one "type" of player is better suited at certain types of kicks than others. If I had to make 10 punts from the 50 yard line (dumb idea given your other research!) I would want a kicker like Scifres, not Lechler. Just because one kicker is asked to make a punt like that doesn't make them a worse punter, they are just being used differently.
Your work here is an excellent measurement of how much value the team gets from punting. But its hard to measure a player's quality because that isn't something you can do with one score.
I'm sure that we could dig further in to measure player's capability at different types of kicks. I'm sure Lechler is the king of the long kick, and among the top at the medium kicks. But I'd wager that there are several kickers who are much better at the shorter kicks. The Raiders do get to use his strength more than most teams.
For place kickers you have the same sort of problem. One guy might be dependable from the 40 in, but not have the leg to hit a 55+. While another might have a well above average chance at making a 60 yard kick but be expected to shank a 25 yarder more often than most.
If one team only ever kicked within the 40 all year long, the former is the 'better player'. But if that same team ended up trying a lot of end of game or end of half 55+ yard attempts the latter player would be 'better'. Unfortunately, there are too few long kicks in a single year to measure a kicker's 'long distance' ability accurately, so such a study would have to span several years.
It seems to me this approach is still going to be biased. Take two punters who are both exactly 1 standard deviation above the mean. The one who attempts a higher percentage of punts from positions on the field or at times in the game where/when +1 SD results are the most valuable will have significantly better numbers. And specifically, I suspect (though I haven't looked at the data) that punts from fairly deep in your own territory -- which are more likely to be correct in the first place -- are probably also more important.
This could be figured out fairly easily by essentially repeating your graph above placing "line of scrimmage" on the X axis and "standard deviation of EPA" on the Y axis.
As for evaluating the skills of particular punters, there may be a better way, and this is off the top of my head, but I guess it could be fairly accurately approximated by taking their averages from each yard line -- counted by standard deviations above the league mean for that yard line -- and then average those SDs, weighing by the league frequency of kicks from each position AND the "importance" of each kick (i.e., the standard deviations of the EPA). Obviously there could be outlier issues, but those could be solved by smoothing out the data first. Of course, you could go more accurate by breaking it down further for different game situations and such, but I think the benefits of that would be pretty marginal.
Brian,
Couple of quick questions on the EPA model as I was trying some things with the files you provided.
1) How are fumbles on punts handled. For example if above Lechler punted the ball to Cribbs and he fumbled it which led to an oakland TD the play would show as a huge +EP even though he didn't have anything to do with it. Does Lechler get this credit or do you base the EP for the punt and return yards only? I guess this would be a similar question to QB's. If Jamarcus Russell completes a pass to Heyward - Bey and Bey fumbles does Russell get penalized.
2) In one comment on an article I was reading last night said that TD's were worth 6.4pts because you have to subtract .6 points but most of the time you have said you subtract .7. Was the .6 a mistake or have you modified this number? Sorry I forget which article it was commented on but it was a fairly recent one.
3)Do you subtract the .7 (or .6) from every play or just the scoring plays? For instance, i think you have said having the ball at the 27 yard line is worth .7points. Is this after subtracting out .7 to where it would be worth 1.4 if there was no subsequent kickoff.
Thanks for your answers and all the great analysis and especially for posting all of the great play by play data.
Sorry another question I forgot to put in this post. I know we are looking at the next score for all drives and assigning them back to the original plays but how do you account for drives that don't have any points scored in them. For example, lets say two teams are scoreless at the half. Do you exclude all plays in the first half (1st qtr since you only used first qtr plays) since there was no "next score" or do you use a zero as the "next score"? I can see some merit to both. Thanks again!
1) Ideally, I'd only credit to the point where the punt lands, then adjust for the average expected return. But I just don't have the time to go into that level of depth, so this current measure includes anything that happens on a punt play including turnovers.
2) The .6 or .7 is just a matter of rounding and how you calculate it. Once you adjust all the EP values accounting for kickoffs, now the kickoff EP value changes itself. So you have to do it again. It's iterative. In the end it doesn't matter that much when measuring individual plays because the starting and ending point for each play are equally affected by whichever value you chose.
3) The .6/.7 EP adjustment is only for scoring plays, but then that affects the value of every down at every yard line. So the answer is yes and no, both, but not.
4) If two teams are scoreless through the half, it would count as zero EP (in my current implementation). I could see where you might want to throw them out, but either way, that's extremely rare.