
 One of the neat features on the individual stat pages are some receiver stats you don't typically see. There's targets, target percentage, yards per target, catch rate, and deep percentage. Occasionally you'll find target stats on conventional stat sites, but I think target percentage is more interesting--the percentage of team targets each receiver gets.
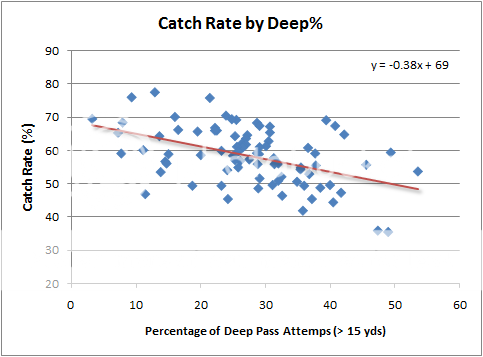
The other day I was sorting the WR stats page by Catch Rate (CR), which is simply receptions per target. I wanted to see which guys had the better hands. To no surprise, catch rate is closely related to how often a receiver is thrown deep balls. Deep% is the proportion of targets thrown in the air deeper than 15 yds past the line of scrimmage. The relationship between CR and Deep% for receivers with at least 40 targets in 2009 is plotted below. The relationship in 2010 shows virtually the same pattern, but is slightly more scattered because of the smaller sample.
For the 2010 season (through week 6), here are the leaders in Catch Rate Above Expected. There seems to be some sort of connection between having a hyphen in your surname and dropping passes.
| Rank | Player | Team | %Deep | CR(%) | ExpCR | Difference |
| 1 | A.Collie | IND | 24.1 | 81.5 | 59.8 | 21.7 |
| 2 | K.Walter | HST | 21.4 | 78.6 | 60.9 | 17.7 |
| 3 | J.Maclin | PHI | 41.7 | 69.4 | 53.2 | 16.2 |
| 4 | J.Shipley | CIN | 15.8 | 78.9 | 63.0 | 15.9 |
| 5 | M.Thomas | JAX | 29.3 | 70.7 | 57.9 | 12.8 |
| 6 | J.Avant | PHI | 16.7 | 75.0 | 62.7 | 12.3 |
| 7 | R.Wayne | IND | 30.8 | 69.2 | 57.3 | 11.9 |
| 8 | M.Manningham | NYG | 42.9 | 64.3 | 52.7 | 11.6 |
| 9 | D.Driver | GB | 23.1 | 71.8 | 60.2 | 11.6 |
| 10 | R.Moss | MIN | 62.5 | 56.3 | 45.3 | 11.1 |
| 11 | R.Williams | DAL | 32.3 | 67.7 | 56.7 | 11.0 |
| 12 | M.Austin | DAL | 21.7 | 71.7 | 60.8 | 10.9 |
| 13 | S.Breaston | ARZ | 25.0 | 70.0 | 59.5 | 10.5 |
| 14 | D.Branch | NE | 16.7 | 72.2 | 62.7 | 9.5 |
| 15 | S.Moss | WAS | 29.1 | 67.3 | 57.9 | 9.4 |
| 16 | A.Boldin | BLT | 29.2 | 66.7 | 57.9 | 8.8 |
| 17 | M.Williams | TB | 59.5 | 54.8 | 46.4 | 8.4 |
| 18 | D.Bess | MIA | 5.6 | 75.0 | 66.9 | 8.1 |
| 19 | H.Ward | PIT | 30.8 | 65.4 | 57.3 | 8.1 |
| 20 | J.Gaffney | DEN | 18.9 | 69.8 | 61.8 | 8.0 |
| 21 | M.Floyd | SD | 56.8 | 54.5 | 47.4 | 7.1 |
| 22 | W.Welker | NE | 6.7 | 73.3 | 66.5 | 6.8 |
| 23 | R.Parrish | BUF | 31.8 | 63.6 | 56.9 | 6.7 |
| 24 | D.Bryant | DAL | 28.6 | 64.3 | 58.1 | 6.2 |
| 25 | S.Smith | NYG | 31.5 | 63.0 | 57.0 | 6.0 |
| 26 | E.Royal | DEN | 17.0 | 68.1 | 62.5 | 5.6 |
| 27 | M.Colston | NO | 20.0 | 66.7 | 61.4 | 5.3 |
| 28 | C.Stuckey | CLV | 14.3 | 67.9 | 63.6 | 4.3 |
| 29 | E.Bennett | CHI | 8.7 | 69.6 | 65.7 | 3.9 |
| 30 | H.Nicks | NYG | 24.6 | 63.2 | 59.7 | 3.5 |
| 31 | R.White | ATL | 24.6 | 62.3 | 59.7 | 2.6 |
| 32 | A.Johnson | HST | 34.5 | 58.2 | 55.9 | 2.3 |
| 33 | A.Randle El | PIT | 33.3 | 58.3 | 56.3 | 2.0 |
| 34 | J.Nelson | GB | 23.8 | 61.9 | 60.0 | 1.9 |
| 35 | J.Knox | CHI | 47.1 | 52.9 | 51.1 | 1.8 |
| 36 | K.Britt | TEN | 29.6 | 59.3 | 57.8 | 1.5 |
| 37 | L.Moore | NO | 18.5 | 63.0 | 62.0 | 1.0 |
| 38 | C.Johnson | DET | 45.5 | 52.7 | 51.7 | 1.0 |
| 39 | D.Mason | BLT | 37.2 | 55.8 | 54.9 | 0.9 |
| 40 | J.Jones | GB | 37.0 | 55.6 | 54.9 | 0.7 |
| 41 | D.Nelson | BUF | 18.8 | 62.5 | 61.9 | 0.6 |
| 42 | B.Marshall | MIA | 28.6 | 58.7 | 58.1 | 0.6 |
| 43 | J.Jones | HST | 7.4 | 66.7 | 66.2 | 0.5 |
| 44 | D.Butler | SEA | 25.0 | 60.0 | 59.5 | 0.5 |
| 45 | N.Washington | TEN | 50.0 | 50.0 | 50.0 | 0.0 |
| 46 | B.Edwards | NYJ | 34.2 | 55.3 | 56.0 | -0.7 |
| 47 | D.Henderson | NO | 24.1 | 58.6 | 59.8 | -1.2 |
| 48 | L.Evans | BUF | 41.4 | 51.7 | 53.3 | -1.6 |
| 49 | M.Williams | SEA | 14.7 | 61.8 | 63.4 | -1.6 |
| 50 | D.Amendola | SL | 3.6 | 65.5 | 67.6 | -2.1 |
| 51 | B.Lloyd | DEN | 35.9 | 53.1 | 55.4 | -2.3 |
| 52 | G.Jennings | GB | 36.8 | 52.6 | 55.0 | -2.4 |
| 53 | M.Wallace | PIT | 48.0 | 48.0 | 50.8 | -2.8 |
| 54 | D.Bowe | KC | 50.0 | 46.9 | 50.0 | -3.1 |
| 55 | D.Jackson | PHI | 35.1 | 51.4 | 55.7 | -4.3 |
| 56 | C.Ochocinco | CIN | 17.8 | 57.8 | 62.2 | -4.4 |
| 57 | B.Hartline | MIA | 41.9 | 48.4 | 53.1 | -4.7 |
| 58 | D.Hester | CHI | 32.0 | 52.0 | 56.8 | -4.8 |
| 59 | P.Harvin | MIN | 22.2 | 55.6 | 60.6 | -5.0 |
| 60 | L.Murphy | OAK | 38.5 | 48.7 | 54.4 | -5.7 |
| 61 | J.Cribbs | CLV | 28.0 | 52.0 | 58.4 | -6.4 |
| 62 | C.Davis | SD | 27.6 | 51.7 | 58.5 | -6.8 |
| 63 | M.Clayton | SL | 19.0 | 54.8 | 61.8 | -7.0 |
| 64 | J.Morgan | SF | 23.5 | 52.9 | 60.1 | -7.2 |
| 65 | J.Cotchery | NYJ | 23.7 | 52.6 | 60.0 | -7.4 |
| 66 | T.Owens | CIN | 25.0 | 51.7 | 59.5 | -7.8 |
| 67 | L.Fitzgerald | ARZ | 33.3 | 48.1 | 56.3 | -8.2 |
| 68 | S.Smith | CAR | 20.0 | 52.0 | 61.4 | -9.4 |
| 69 | M.Crabtree | SF | 15.6 | 53.3 | 63.1 | -9.8 |
| 70 | St.Johnson | BUF | 9.7 | 54.8 | 65.3 | -10.5 |
| 71 | M.Sims-Walker | JAX | 22.2 | 50.0 | 60.6 | -10.6 |
| 72 | H.Douglas | ATL | 28.1 | 46.9 | 58.3 | -11.4 |
| 73 | S.Stroughter | TB | 16.7 | 50.0 | 62.7 | -12.7 |
| 74 | D.Gettis | CAR | 22.7 | 45.5 | 60.4 | -14.9 |
| 75 | D.Heyward-Bey | OAK | 40.5 | 37.8 | 53.6 | -15.8 |


Where does the "deep" data come from?
Deep% is the proportion of targets thrown in the air deeper than 15 yds past the line of scrimmage.
A minor nitpick, but whats the deal with CLV, SL, BLT and HST abbreviations instead of CLE, STL, BAL and HOU like people usually use?
Does Randy Moss data include his stint in NE?
Yes. Ditto for Branch and SEA.
CLV, SL, BLT, HST, and ARZ are what the NFL officially use.
CLE, STL, BAL, HOU, and ARI are what everyone else uses.
Have you looked at trying to determine a league-wide expected catch rate vs. pass attempt distance? We know, roughly, the probability of making a 30-yd field goal; what's the probability of catching a 30-yd pass?
Brian,
This is a great article. Hopefully you can post updates quarterly, or at least at the end of each year.
>.But the correlation is considerable at 0.47, and at the very least, it's one piece of the puzzle.
This is good to know also, thank you for mentioning it.
@Brian,
Are some of the media abbreviations already used in official NFL stats? Like HOU for Oilers or BAL for the old Colts? I can see the media falling back into what they are used to, even though the NFL decided they needed a new value.
Have you looked at correlation from year to year in CR% over ExpCR? If there is a strong correlation for QB/WR tandems, is there enough turnover of WRs and QBs to try to split some of the CR% between the 2 positions? I suspect there'd be pretty low confidence in the latter, but it might be interesting to look at.
Brian-
Since I know you enjoy clever acronyms, did you consider that this stat is perfect for one? Specifically,
Catch
Rate
Above
Predicted
Good one
Semi Worthless stat because of the QB. Lets see what Larry Fitzgerald's numbers were when he had Kurt Warner tossing the ball to him.
This would be great if dropped passes were a stat available in play by play, not just targets.
I think a better way to look at these specific stats is for comparison between WR's on a team, since that takes the QB and most play calling out of the equation.
Brian,
Are you aware of a way to extract yards-after-catch (YAC) data from the NFL play-by-play data available on your site? Perhaps the use of "air yards" per catch would be more explanatory than a "deep or not deep" dummy variable.
It's interesting that the NYG had 3 deep threats by the time I got down to NE's deep threat: D. Branch... I'm sure Ocho and Underwood were meant to be a deep threat, but they were supposed to fill the greatest deep threat in the NFL: R. Moss. Will the Pats continue to look for a Manningham/Cruz in next years draft?