

The ability to over-perform in clutch situations as a persistent skill almost certainly does not exist. (More on this in a future post on year-to-year correlations in general performance levels and clutch performance levels.) But that's not to say that some players' better moments happened to have occurred when things mattered the most. Although clutch as a quality or skill does not exist, clutch as an event certainly does.
Trying to define clutch is a tricky business. It's an arbitrary exercise with no one correct answer. Should we count situations where a team is down one score or two? With 5 minutes left to play? 4 minutes left? The final 10 minutes of a game?
My solution is to compare a player's Expected Points Added (EPA) with his Win Probability Added (WPA). EPA measures total production without respect to time and score. In contrast, WPA is heavily weighted by game situation. Players whose WPA exceeds what we'd expect based on their EPA could be thought of as clutch, and players whose WPA is below what we'd expect could be considered anti-clutch.
For example, consider the 2010 post-season. Mark Sanchez's Jets triumphed over both Peyton Manning's Colts and Tom Brady's Patriots. Part of the reason was that Sanchez happened to save some of his best moments for critical situations. Based on his 2010 post-season EPA of 16.4 points, we would expect a total of 0.40 WPA. But he actually notched 0.73 WPA, almost twice the expected 0.40. The difference is clutch-WPA, and in Sanchez's case it's 0.33, the most clutch for the 2010 post-season.
But that year belonged to Aaron Rodgers who accumulated an astounding 50.0 EPA and 1.0 WPA in 4 post-season games and won the Super Bowl. But we would have expected even more WPA based on his overall production. His clutch-WPA was -0.4. Before you jump to the conclusion that such a result renders this definition of clutch absurd, consider how that Super Bowl ended. Rodgers and GB were up by 3 in goal-to-go field position with just minutes left to play. A TD would have clinched the game, but a FG would have only set up PIT for a potential game-stealing TD drive. Rodgers couldn't convert, and a GB FG gave PIT the ball trailing by 6 with 2:15 to play. The GB defense hung on to seal the win, but had PIT scored we'd consider Rodgers' final drive a colossal disappointment.
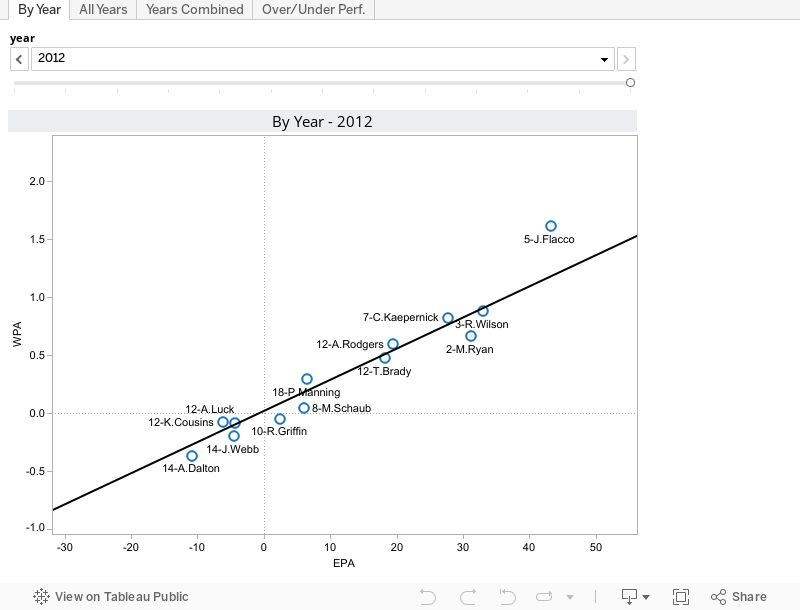
With all the talk about Kaepernick's and Flacco's clutch play this post-season, I thought I'd take a look at where they lie on the EPA-WPA plane and how they compare to other QBs as far back as 2000. I built a viz that plots QB performance with EPA on the horizontal axis and WPA on the vertical axis. The trend-line represents the expected WPA for each QB's EPA, and the vertical distance above the trend line represents the clutch-WPA of that QB.
There are four tabs. The first plots each QB's post-season performance by year. You can use the controls at the top to click through each year. The second tab plots all the individual year performances on the same chart. It's pretty crowded, so use the zoom controls or double click on the chart to easily identify all the QBs. The third tab plots the aggregate EPA and WPA for each QB over the entire period 2000-2012 (prior to the 2012 season's SB). The fourth tab lists the QBs of the period in order of most clutchiness to least clutchiness in the postseason.
Matt Hasselbeck is at the bottom of the list as one of the least "clutch" playoff QBs of the era. That's mostly due to his interception returned for a TD in overtime against GB in the 2003 wildcard round. The head-scratchers are Rodgers and Roethlisberger. Rodgers, besides the example above, isn't clutch because he perfroms so darn well when it matters the least. Why can't he play just as well when the chips are down? Half of his -1.0 clutch-WPA comes from the freak fumble returned for a TD at the start of overtime against ARI in 2009.
Roethlisberger is hurt in the clutch department by two games in particular. His 2007 loss to Jacksonville was highly productive, but he couldn't seal the game in the end. He also came up short in critical situations in his loss to the Broncos in 2011.
Just to be completely clear, this analysis is not suggesting Rodgers and Roethlisberger are poor QBs in the playoffs. Not one bit. The point is that their overall production, without respect to game leverage, would suggest they might have had an even more successful playoff career than they have so far.


I'm a little surprised that Manning is as highly ranked as he is. Seems to counter the dominate media narrative of Manning being a 'Post-Season Choker'.
For Manning (and most quarterbacks) he media are doing a slightly different analysis in their heads. They are not comparing EPA to WPA within the post-season. They are comparing WPA in the post-season to WPA in the regular season. In this respect, and I haven't looked at the numbers, I imagine that Manning does under-perform.
No Joe Montanna, You list is invalid
Uh...the list only goes back to year 2000. That's why there's no Joe Montana, Johnny Unitas, Terry Bradshaw, etc.
No Kobe. Invalid.
Joe - Here are the stats on Manning:
Regular Season: EPA/P: 0.24, WPA/G: 0.24
Playoffs: EPA/P: 0.16, WPA/G: 0.22
For comparison, Tom Brady:
Regular Season: EPA/P: 0.20, WPA/G: 0.19
Playoffs: EPA/P: 0.12, WPA/G: 0.18
Manning's WPA drops off slightly in the playoffs, but so does Brady's. And Manning still has a higher WPA in the playoffs.
Also, no Tony Montana. Invalid.
I'll do a reg season vs. post-season WPA comparison soon. Wish I could go back to Montana and even earlier...
Fun thinking about who performs above their norm, but in the end, one should be much more interested in WPA.
I mean, on the "Years Combined" chart, Steve McNair rates as a clutch performer (datapoint above the line) and Aaron Rodgers rates as a choker (below the line).
But Rodgers' WPA is higher than McNair's, implying that even when he chokes, you'd rather have Rodgers.
Joe, I think you are being too charitable when you say that the media is comparing Manning's (and others') postseason WPA to their regular season WPA. That's much more sophisticated than what I think they are really doing, which is just looking at wins, and in particular, Super Bowl wins, and ignoring what particular factors led to wins or losses in a given game.
I agree with Tarr...for the most part, the media just looks at who won the game, and then states that the losing quarterback "choked" or didn't do enough, etc.
@TPM and Tarr: exactly. The QB's performance isn't even considered, only the final result.