
As always, these numbers come courtesy of Chris Cox at NFL-forecast.com and are generated with the help of his NFL-Forecast software app, which uses the win probabilities generated by the team efficiency model to create a Monte Carlo season simulation. And if you don't buy the game probabilities from Advanced NFL Stats, you can tweak them as much as you like to generate your own playoff projections. I encourage everyone to download the app and test out your own scenarios.
It's always fun to go back earlier in the season to see how far off the initial projections were. In Week 9, the projected division winners in the AFC were NE, PIT, HOU, and DEN. (BAL and PIT were about 50/50, as were NE and MIA(!).) The most likely wildcards were BAL and MIA. OAK looked to be a better shot than either IND or CIN. Ouch.
In the NFC the forecast winners were NYG, CHI, ATL, and SF, although CHI was only at 50%. The NFC wildcards were GB and SEA. Not too shabby.
Playoff Projections - Week 16

Why Is a Backup RB a Fantasy Star?

Jason recently theorized why David Wilson, a backup RB for the Giants, is on rosters of winning fantasy teams. (His teams have the 6th best winning percentage of all NFL players.) His theories were:
1) Smart fantasy players overlook previous outcomes and understood his ability to have a high payoff as a RB on a team that can move the ball.
2) Wilson was a scrub who was stuck as a backup behind teams who already had a very healthy RB situation with little reason to go digging for better options.
3) Wilson got his opportunity very late in the season after losing fantasy owners had long since given up prowling the waiver wire. Fantasy teams in the playoffs, which already solidified winning records, would tend to be the ones looking to plug holes in week 15.
All excellent theories, but I'd like to add 1,387 more to that list. Those are the number of return yards Wilson has accumulated this season. How does your league score return yardage? I bet you don't even know. The last time I won my fantasy league it was party because of Percy Harvin's massive return yardage. Return yardage is probably only part of the answer, but in many leagues it can be overlooked.
Weekly Game Probabilities - Week 16
 Game probabilities for week 16 are up at the New York Times' Fifth Down.
This week I highlight one the least interesting match-ups on a schedule packed with interesting games.
Team Efficiency Rankings - Week 16
SF and DEN lived up to their rankings last week. In fact, 8 of the top 10 teams won last week, and the only two losses were by teams beaten by higher ranked teams.
Cowboys Kick (Twice), But Still Win
 In one of the more intriguing match-ups of the weekend, Tony Romo and the Cowboys received the ball in a tie game just over midfield with 0:47 seconds remaining. After two incompletions and one pass to Jason Witten, the Cowboys faced a 4th-and-4 at the Steelers 43-yard line. With 0:32 seconds to go and one timeout left, the Cowboys trot out their field goal team for a miraculous 60-yard game-winning kick. Both teams would call timeout and Jason Garrett would ultimately decide to punt instead, essentially assuring overtime. Let's think about this decision generally before looking at the frequency specifics.
If you punt, you are conceding to play overtime, giving your team a 50/50 shot to win the game. If you kick a field goal from that range, the probability that it goes in is at best the same as the probability that you miss and your opponent can score before the end of regulation, giving you a 50/50 chance to win optimistically. If you go for it and convert, you will have a much higher probability of making the field goal even with time constraints -- if you fail, you are pretty much in the same situation as a missed field goal.
New Feature: Time Calculator

I created a new tool to estimate the time at which a trailing defense (or soon-to-be-trailing defense) can get the ball back if they force a stop. The results are based on the time at the first down snap of a series and the number of timeouts remaining for the defense. You can adjust the expected duration of each play and the time consumed between the previous whistle and the next snap when the game clock is not stopped. The defaults are 6 and 39 seconds respectively. The calculator assumes there will be no stoppages due to reasons other than timeouts and the two-minute warning, such as incomplete passes, runs out of bounds, or penalties.
One additional feature is that you can check a box called "Save Timeout." This will indicate that the team on defense would prefer to allow the clock to wind down to the two minute warning rather than stop the clock with a timeout. For example, if the defense has one timeout left and the second down play ended at 2:10, the defense can elect to save the timeout for its offense in exchange for running down the 10 seconds to 2:00. This is, in effect, a trade-off between the 10 seconds of game clock and having a timeout available for an offensive drive.
It's very difficult to quantify the value of the timeout on offense. It's intuitively very valuable because an offense can use the middle of the field, which otherwise allows the defense to guard the sidelines.
Try this: Enter 2:24 remaining with 3 timeouts. Leave the 6 sec and 39 sec defaults for play and inter-play durations. Click calculate with the Save Timeout option unchecked and checked (with the 12-second default cutoff value). With 'Save Timeout' checked, you get the ball back with 1:54 and retain a timeout for your offense. Without the option checked, you get the ball back with 2:00 on the clock and no timeouts, with the 2-minute warning essentially going to waste.
This option usually only makes a difference when the defense begins the series with all three timeouts remaining. It also may be smart depending on when a team can expect the change of possession to occur. The defense does not want change of possession to occur on a play that spans the two minute warning because that combines two potential clock stoppages into a single stoppage.
The workings of the NFL game clock is far more complex than it might seem. That's why I forced myself to build the calculator and think through all the considerations. The algorithm behind the calculator is basically a by-product of the one I used to create the chart below, which underpinned my analysis of when a defense should prefer to intentionally allow a TD.
C.J. Spiller and the Effect of Increased Carries
The NFL leader in expected points added for a running back? It's not rushing leader Adrian Petrson. It's not Marshawn Lynch, Doug Martin, Alfred Morris or Jamaal Charles -- the rest of the top five in rushing yards.
With 40.2 EPA -- a full 17 points clear of second-place Peterson -- Spiller holds the lead through Week 14. Despite only 144 carries -- 25th in the league, between Vick Ballard and Jonathan Dwyer -- he ranks 12th in rushing yards. His 944 on the season puts him between BenJarvus Green-Ellis and Shonn Greene, rushers with 94 and 86 more carries respectively.
Now, with Fred Jackson on injured reserve with a right knee injury, Spiller will be alone at the forefront of the Bills offense. Of course, Bills coach Chan Gailey qualified his statement:
"We'll play CJ as much as he can play," Gailey said. "Tashard [Choice] will rest him when he needs rest."
Last time Spiller was healthy and Jackson was out -- Week 10 against Miami -- Spiller received 22 carries, a career high, rushing for 91 yards and adding three receptions for 39 yards. At -0.2 EPA (-0.01 per play), it was his third-worst game of the season, but still better than the league running back average of -0.02 EPA per play.
Still, when a player puts up numbers like Spiller's over the past two seasons -- 6.0 yards per carry on 251 rushes -- one would figure his coaches have a reason for limiting his carries so heavily -- and a better one than just Fred Jackson's roster presence, capable as he may be.
But so far in his career, the only two times Spiller has gone over 16 carries -- the aforementioned Week 10 against Miami and 2011 Week 11 against the Jets (19 carries, 55 yards) -- he has had trouble. It's easy to get caught up in efficiency, but in many cases volume is valuable in and of itself.
So, the question: is there reason to believe running backs get worse with more carries? In sports, we often see a usage-efficiency tradeoff -- pitchers get worse the deeper they go in games, basketball players tend to shoot a worse percentage the more looks they take from the field, and, as detailed last week, quarterbacks get less efficient the more than have to throw the ball. Does the same apply to runners?
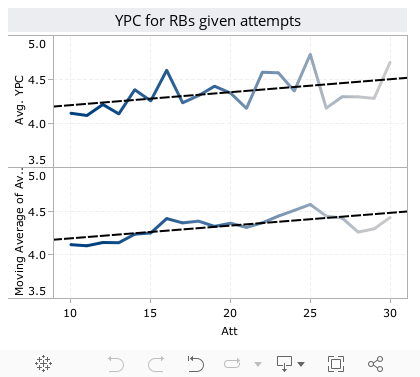
To answer the question, I pooled all games of at least five carries and fewer than two passes (to weed out running quarterbacks) from 2010 through this season, a total of 2349 games featuring rushers from Aaron Brown to Willis McGahee.
There actually appears to be a positive correlation -- more carries means more yards per carry -- but this is lkely due to survivor bias. That is the players who don't earn at least 10 carries don't get them, dragging the average down at the low end, and the players who get 30+ carries are typically destroying opposing defenses. Chopping off the extremes and looking at games with 10-30 carries gives us a nearly flat relationship:
Playoff Projections - Week 15 *Updated*
As always, these numbers come courtesy of Chris Cox at NFL-forecast.com and are generated with the help of his NFL-Forecast software app, which uses the win probabilities generated by the team efficiency model to create a Monte Carlo season simulation. And if you don't buy the game probabilities from Advanced NFL Stats, you can tweak them as much as you like to generate your own playoff projections. I encourage everyone to download the app and test out your own scenarios.