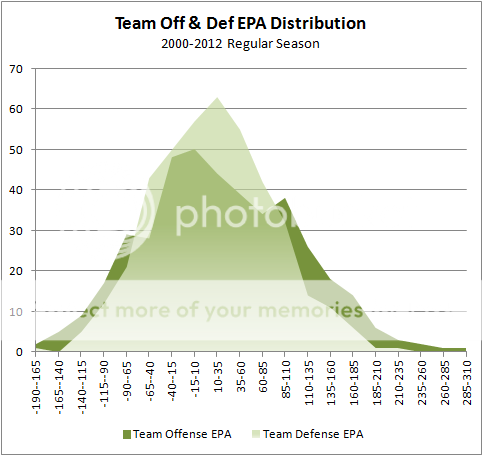
A few weeks back I wrote about how the distribution of team offensive production is measurably wider than team defensive production. Although I've written about the phenomenon a few times over the years, it never hurts to apply newer and better analytic tools to the question.
I had produced this histogram to illustrate the comparison between offense and defense, but the format doesn't mesh very well at NYT. For those not familiar, a histogram plots the frequency of occurrence of various levels of a variable. In this case it's a plot of team total Expected Points Added (EPA) for the 2000-2012 regular seasons. For example, there were 62 defenses (the lighter plot) that totaled between 10 and 35 EPA for a season. And there were 43 offenses that totaled the same amount.
Note that the distribution of offenses is wider than that of defenses. This means that the best offense in any given season will tend to produce more EPA than the best defense in a season. The distributions are very normal, meaning very bell shaped.
Offenses tend to skew leftward--notice the darker distribution leans to the left. This means offenses tend to congregate as mediocre, and tend to thin out as we look rightward along the performance spectrum.
Note: I inverted the defensive distribution for comparison purposes. The way I normally do things is call good defense as 'negative' EPA. In the histogram above, 'positive' EPA is good for defense so that both good offenses and good defenses are on the right side.


I would say 'not to nitpick', except I'm going to nitpick. You can't have a distribution that is normal and skewed.
True. Nothing is ever perfectly normal.
And to join in the nitpick-fest, "very normal"?
Would you be happier with a chi-square test, or can we all agree that my point was that these distributions are "well-modeled" by a Gaussian distribution?
The skew normal distribution is 'a thing' so I throw my red challenge flag on the nitpick. As a generalised normal distribution, it's fine.
How is defensive EPA counted again?
^^ It's an inverse function of offensive EPA. Net EPA of all plays. Only defensive EPA is always negative.