

With new and better data, I redid the study. This time I have actual temperatures and used all non-preseason games from 2000 through the wildcard round of the 2011 season (last Sunday). Here are the results. The graph below depicts the winning percentage of the road team by temperature at kickoff. Road teams are classified according to their home climate--dome, cold, moderate, or warm.
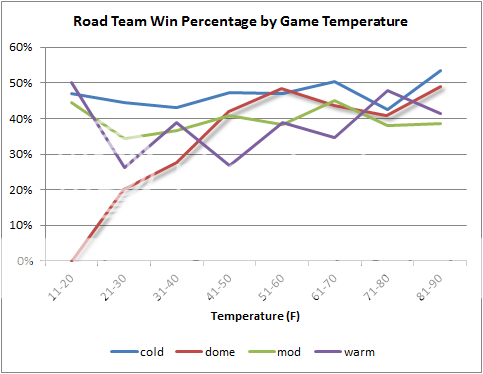
Just as we saw in the original study, dome teams playing in cold weather appear to be at a severe disadvantage. And just as we might expect, teams from warm cities struggle quite a bit as the temperature drops. The teams from moderate climates are less affected, and the teams from cold climates don't appear to be affected at all.
Sample sizes get smaller as the temperature drops. In the 11-20 degree bin, there are 17 cold visitors, 8 dome visitors, 9 moderate visitors, and 6 warm visitors. In the 21-30 bin there were 45, 15, 32, and 19 cold, dome, moderate, and warm visitors. Taken as a whole, however, the trends appear undeniable: The less acclimated a team is to a cold climate, the worse it fairs.
Zero out of 8 dome teams in the data set won in cold weather 20 degrees or below, and only 3 out of 23 (13%) have won in temperatures 30 degrees or below.
There are two potential dome at cold match-ups for the remainder of the playoffs--New Orleans at Green Bay and Houston at New England.
A few notes: 308 out of the approximately 3000 games since 2000 did not have temperature data recorded and were excluded. I haven't checked them all, but I suspect a good chunk of those were played in domes. Super Bowls were excluded. Climate classifications were based on city average wind chill for the month of December. Cold teams were BUF, CHI, CIN, CLE, DEN, GB, KC, NE, NYG, NYJ, PHI, and PIT. Dome teams were ATL, DET, IND, MIN, NO, and STL (and DAL after 2009 and ARI after 2005). Moderate teams were BAL, CAR, DAL, OAK, SF, SEA, TEN, and WAS. Warm teams were ARI, HOU, JAX, MIA, SD, TB.


Doesn't affect the playoffs much, but I'd be curious how teams with homes in moderate climates and domes do in Sept/Oct in games at warm-weather sites.
Dome teams: the Challenger O-rings of football.
Based on the opponents and the GWP for those dome teams, what would be their expected winning percentage in those games?
@ anon:
Looking at the graph I would guess not to shabby.
In difference to common conception here in new England cold teams traveling into warm temperatures do as usual.
The data here is interesting, but it does have some selection bias. The small amount of very cold data has a very high probability of being played in the playoffs, meaning a higher quality opponent. This means they are more likely to lose that game in the first place.
This isn't a "statbreaker", but normalizing for this would probably make the effect seem less dramatic
Matt, that's a great point. I reran the numbers quickly without playoff games. I get a 20% win% for dome teams playing below 30 deg, 30% for 31-40 deg, 38% for 41-50 deg. I can post more complete numbers if anyone is really interested.
G-I'm not sure. That would require a much more thorough analysis, but you can compare them as a group to how well they played in milder temperatures. In other words, you can answer that question with a simple comparison within each group of teams between how well they play in the cold and how well they play when it's warmer.
Also, as a teaser, I've got some really interesting results with regard to the effect of temperature and wind on passing and running, including one head-scratcher. Will post soon.
How much of this effect is related to the teams in each weather group? I assume most games played at below-freezing were against cold weather teams like the Pats, Steelers, Packers, etc that have been generally good in the last decade while most of the warm games were against warm weather teams that haven't been as good in the last decade.
+1
Stats joke FTW
xkonk-That's an important factor, but the answer is in the graph. See my response to 'G' above.
Looks like we now have response options on the comments. I need to get with the program on my own site!
Standard errors would be useful here.
Great post! But I feel it could have been improved by a reference to the "frozen tundra of Lambeau Field" and the tune "What Shall We Do with a Drunken Sailor?" playing in the background.
Yes, this only fair way to analyze if the effect is real or not. The "sample" of games of domed vs. cold is not a random sample. The same teams (with similar personnel/coaching/management) have domes every year, and they will tend to face similar cold-weather teams. Also, if you have a tiny sample, you need to look at margin of victory as the result, not raw wins and losses. I came away from this article concluding nothing.
Again, you can compare a set of teams win% in cold weather to the same group's win% in warmer weather. You don't need a fancy regression to see what's clearly evident.
I'll walk you through it if you need me to.
Had to disable the respond feature on the comments because of a bug it's causing in IE.
It seems you could take a "WPA-flavored" approach to this. For each temperature bin, sum the GWP-model predictions of win percentage, and subtract the actual win fraction. Then fit the difference to a function of the temperature. This would allow you to use the playoff data without special exception-handling.
Alternatively, you could create four temperature-dependent coefficients (linear is likely sufficient) and add them into the GWP model the same way HFA is accounted for. You then determine the four functional forms by minimizing difference of the complete set of results, relative to the GWP model, by adjusting the functional parameters. (Each game would get two temperature-dependent factors, one for each team. For teams that both fall into the same category, they would cancel.)
"Clearly evident?" You make some pretty absurd assumptions about your data set. You assume:
1) There has been no correlation between a team's stadium type (outdoor/dome) and the team's quality.
2) There has been no correlation between a team's status as a dome team and the quality of opponent it has faced.
3) There has been no correlation between a team's status as dome team and the team's avg. opponent HFA.
4) There is no correlation between similar home/road climate (warm team playing in warm road stadium), closer home/road geographic difference, and therefore a lower home field advantage. I.e., you are capturing some of the distance-traveled component of HFA by not controlling for it.
5) Raw win-loss record is sufficient to assess past performance over very small samples.
So when you simply measure the win-loss records of a member of Group A vs. a member of Group B, you are not really isolating anything. The results could be caused by differences in overall quality between groups A and B, unusually high/low non-weather-related HFA magnitudes within group B, and, most importantly, random variance. You need to take the time to measure actual underperformance as a function of temp. If you do that, you might be surprised at the results.
Do you have the ability to test for snow/rain as opposed to just temperature with your data set? There's an oft cited belief that snow depresses scoring - a belief which Belichick has said is unfounded, in that it slows down pass rushers.
The other request I have is that it'd be interesting to see more of a breakdown of the numbers. Does it affect yards per attempt? Yards per rush, etc...? Are completion percentages lower?
Looking at the blue line on the graph (and the lists of teams), cold-weather teams have been obviously superior to those in any other category. When teams are playing in a road game with a low gametime temperature, they are significantly more likely to be playing one of those cold-weather teams. There likely is some effect that colder temperatures have on dome and warm-weather teams, but it's not as extreme as the graphs makes it seem. It would be nice if we could see the difference in win expectancy for different groups of in different conditions with an adjustment made for the strength of the opposing team.
Have you done an analysis on the effect of Denver's elevation?