
 Going into week 9 of the 2008 season, the Washington Redskins were 6-2. Their two losses came in a low scoring affair against the Giants at the Meadowlands, and in a fluky 19-17 game hosting the Rams. They had beaten division rivals and pre-season darlings Dallas and Philadelphia, both on the road. They outscored the prolific Saints and Cardinals offenses. The playoffs were a virtual certainty, and challenging the Giants for NFC supremacy wasn't out of the question.
Then, the Redskins dropped the next 5 out 6 games, falling to 7-7 and eliminating themselves from playoff contention in all but the most improbable scenarios. In fact, despite a late-season win over the Eagles this week, they have been officially eliminated. What went wrong?
Before I go any further, keep in mind that maybe nothing went wrong. Say the Redskins had about a 50/50 shot at winning every one of their games--essentially a coin flip. It's not terribly uncommon for 8 coin flips to turn up 6 heads and 2 tails. And it wouldn't be unfathomable that another few flips wouldn't result in 5 tails and a head or two. In fact, it's looking like the Redskins will finish either 8-8 or 9-7, essentially a coin flip of a team. There's nothing that says a team's 8 wins have to be evenly paced throughout a season.
But teams aren't coins, so I'll take a deeper look at the Redskins' performance game by game. I'll look at their four major components--running and passing, on both offense and defense.
I measure passing performance by adjusted net yards per attempt. This is passing yards minus sack yards, minus 40 yards per interception, per drop back. Running performance is measured simply by yards per run.
Opponent strength is an important factor. For each game I adjust the Redskins' performance in each phase of the game according to how strong the opposing team is in the opposite phase. I simply added the opponent's difference from average to the Redskins' efficiencies. For example, if the Redskins' offensive passing efficiency was 5.0 yds per attempt, and their opponent's season-long yds per att allowed was 1.5 yards above league average, I gave the Redskins 6.5 yds per attempt.
The graphs below plot performance as a 4-game moving average. This is to account for the natural game-to-game variation in performance. We shouldn't expect a team to maintain steady efficiencies in every game they play. Ultimately, the moving average allows us to see team-wide season-long improvements or declines while accounting for opponent strength.
The first graph illustrates opponent-adjusted offensive efficiency for passing and running, and the second illustrates defensive efficiencies.
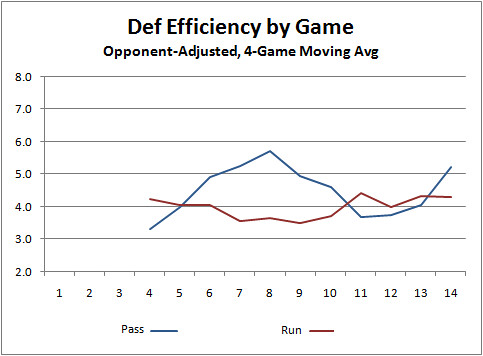
We can see that the defense was relatively steady all year. Oddly, it looks like the pass defense improved following the eighth game, which is when the 1-5 slide started. (Remember lower is better for defense.) The run defense was rock-steady all year.
The rushing offense was equally steady and remained above-average all year. But Washington's passing game showed a steady decline throughout the season.
So it was the passing game, not Portis, not the secondary, not the pass rush. My theory is that they threw too few interceptions early in the year. That's not a typo. I think head coach Jim Zorn or quarterback Jason Campbell became captive to the idea that they were winning because they weren't throwing interceptions. While a lack of turnovers certainly helps win games, if it becomes a passer's primary goal it could be harmful.
Interceptions are a part of the bargain, a natural consequence to throwing the ball. You can guarantee zero interceptions by playing in an extremely conservative way, tossing short passes, taking sacks, or throwing the ball away anytime a defender is in the same zip code as the receiver. You can minimize interceptions, but you'll lose every game doing it.
At some point in the risk-reward continuum, there is an optimum level of risk in passing strategy. I'm guessing the Redskins found themselves too far on the conservative side of optimum.
Anatomy of a Collapse
published on 12/21/2008


Subscribe to:
Post Comments (Atom)
Great post. I'm a Redskins' fan and without looking at the numbers, I had a gut feeling that the their strategy has been too darn timid. Plus, on a subject near to your heart, they punt on so many fourth downs, even on short-yardage at mid-field.
Hi Brian,with you on Washington's offense.I make it they ran for around half a yard per carry more than their opponents defenses allowed other teams to run for up to week 8 and slightly improved on that thru weeks 9 to 15.
Passing offense threw for 7 ypa against teams that are allowing 6.7 ypa to week 8,but declined from week 9 onwards when they only got 5 ypa against 5.9 ypa defenses.So the aerial game went from slightly above average to well below par.
The pass D I rated as above average to week 8 (allowed 5.6 ypa to teams that throw on average for 6.5 ypa).NYG,NO,Zona,Dallas,SL and Cleveland were all below their season ypa average in their early season Washington matchups. But that was totally reversed after the Detroit game.The Redskins allowed teams who combine to pass for 6 ypa to pass for 6.7 ypa.Dallas,NYG,Baltimore,and Cinci each bettered their seasonal passing average against Washington down the stretch.Only Pittsburgh and Seattle fell short.
On the local sports talk station this morning, I heard John Riggins practically reading this article. "Campbell threw too few interceptionss." Used the same wording..."conservative side of risk reward balance...", etc.
The very next segment of the show, Riggins and the co-host were debating how much math can instruct a football team. The Redskins have a math guy on staff who doubles as the QB coach, and the conversation turned into 'what the heck is he doing on the team?'
Can you look at the numbers and tell me why the Eagles are so Jekyll and Hyde this year? Common perception is not enough running plays. After scoring a measly 3 points when they called 48 passes and only 14 runs, its hard to argue, but there are so many other factors. Would love to get your insight!
Another reason is strength of schedule. The first 8 opponents average 6.3 wins after week 16, the next 7 average 8.1. So the Skins played a harder schedule in the second half of the year. They also had some key injuries in the second half...Portis is banged up but playing, Jansen and Griffen (starting off and def tackles) got hurt and missed some time.
I think there is a problem in that football is more of a physical game than a cerebral game.
If a team has bigger, faster, better players, the schemes and play calling become secondary.
Washington does not have the talent and depth of the Cowboys or the Giants. When there are two (maybe 3) teams in your division with more talent, it is becomes hard to be play at a .750
win rate.
Your rating system had the Skins with the higher prob of winning in 10 of 11 games and the skins won 6 of them. So maybe Zorn was "teaching to the test" and trying to manage the stats that "control" winning. But maybe the stats don't control winning, maybe the stats are the product of winning and losing.
I am still amazed that you can produce a win prob that is so accurate from the data you use.