
 One of the storylines this season is the solid performance of two rookie quarterbacks. Ravens QB Joe Flacco and Falcons QB Matt Ryan are having surprisingly good seasons for any QB, much less a rookie. Ryan has done particularly well, especially given the state of the Falcons in 2007.
Another storyline is how well Matt Cassel of the Patriots has stepped into Tom Brady’s shoes. Prior to a tough outing against the NFL’s best pass defense last week, he threw for 400 yards in two consecutive games. Although not a rookie, Cassel had only 39 attempts in his previous three seasons as a back up.
Cassel is likely to end up as a starter on another team next year, but fans of the Ravens and Falcons can be optimistic about the prospects for their teams in coming years. Previous research has looked at the year-to-year trends of QB performance and found that the big jump comes in a passer’s second year of playing. But what about during the rookie year?
Some prominent QBs showed improvement in the second half of their first year playing. In 1998 Peyton Manning’s yards per attempt (YPA) went from 6.4 to 6.6 from his first 8 games to his second 8. Ben Roethlisberger went from 8.5 to 9.3(!) YPA. Tom Brady went from 6.6 to 7.2 YPA. (These are gross YPA, not accounting for sacks or interceptions).
In this article, I’ll look at Flacco’s and Ryan’s game-by-game performance through week 12 to see if we can detect an upward trend. I’ll also look at Cassel’s numbers to see if he exhibits a similar trend.
Performance is measured by adjusted YPA, which is passing yards – 40 yards per interception + 10 yards per touchdown. The 40 yard penalty for interceptions is a commonly accepted adjustment, partly because an interception precludes a punt. The 10 yard increase for each touchdown is not a bonus, but simply accounts for the depth of the end zone and the difficulty of most goal line passes due to the compression of the field. Game-by-game performance can be affected by a variety of factors such as team injuries or weather. Random variation due to small sample size and the strength of opponent pass defenses are probably two of the most important. To account for the small sample size of an individual game, I’ll use a 4-game moving average to chart performance. To account for opponent strength I’ll factor-in defensive pass efficiency. For every yard per attempt more than the league average an opponent yields, I’ll subtract that amount from the individual game performance of each QB. For every yard under the average, I’ll add that amount. In effect, the QBs get extra credit for facing tougher pass defenses, and are penalized when facing weaker ones.
So far this season, Flacco and Ryan have faced slightly above average pass defenses, each averaging -0.1 YPA better than average (lower is better). Cassel has faced slightly weaker opponents, at +0.2 YPA worse than average.
The graph below plots all three QB’s performance in “defense-adjusted” adjusted YPA by game. Game-to-game variations make it very hard to discern any trends, so you might want to skip down to the next graph.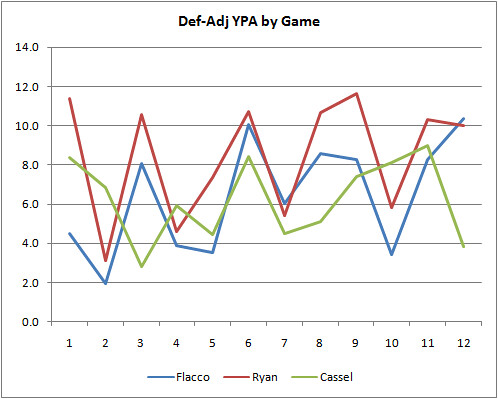
This next graph is a four-game moving average, and it shows the trends clearly.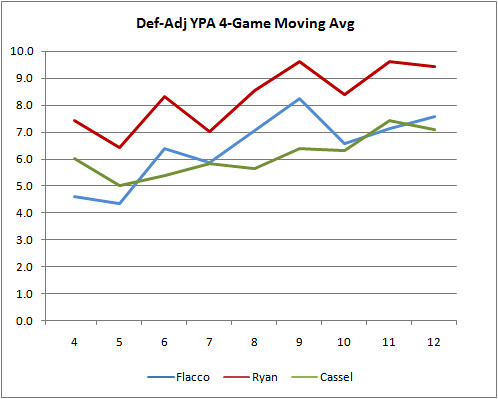
For comparison, the NFL average going into week 14 is 5.8 adj. YPA. Ryan’s season average is 7.6, Flacco’s is 6.3, and Cassel’s is 6.2.
Ryan started the season with the strongest performance, but it’s Flacco who has shown the most improvement. Perhaps that shouldn't be too surprising given Flacco's Division 1-AA pedigree. Cassel, who had already been in the league for three years, started off somewhere between Ryan and Flacco, but has shown a shallower rate of improvement.
I’m not going to draw any concrete conclusions, but it is interesting that all three QBs do show a similar improving trend.
The Learning Curve
published on 12/05/2008


Subscribe to:
Post Comments (Atom)
Brian,
Very good analysis as usual. I don't know how to attach tables and/or graphs to comments, so I have posted my comments to your post on my own blog - newqbrating.blogspot.com. I think you (and your readers) will find those comments interesting (if I should say so myself). Keep up the great work, and I hope to make future contributions to your thoughts.
Cheers,
Kiran
are you familar with the football outsiders article a couple of years ago stating that the best two predictors of NFL success in college QBs are games started and completion percentage?
With that in mind I find myself wondering what the current slate of Big XII qbs are going to look like at the next level, especially when you consider not only have Daniels and Harrell logs 3 years of starting in college, but both logged multiple years in highschool playing in spread offenses, McCoy and Bradford if they stay in school will be able to log 4 years as a college starter,
all have logged completion percentages that put just about every current NFL starter's college completion percentages to shame
those four will have seen more live action attempts than just about anyone we have currently seen to date
Brian,
Your excellent post prompted me to look another 3 quarterbacks, and compare their seasons to each other. Remember the Brett Favre soap opera in the offseason?
The result - Green Bay goes with untested Aaron Rodgers, the Jets trade a conditional draft pick (currently a third round, but maybe a second round, if the Jets make the playoffs) and give up on Chad Pennington for Favre, and the Dolphins pick up Pennington.
I looked at the seasons (through 13 games) for all three. Who do you think made the right decisions, the debatable (wrong?) decisions, and who got awfully lucky?
Your thoughts are appreciated.
Kiran
Kiran-I'm guessing Rodgers isn't too far below Favre so far this year, but his season can't compare to Favre's from last year.
I think the Dolphin's lucked out the most. My system showed them as the strongest team in the AFC E for a while now. Although the Jets' have a better passing game this year, the bulk of their improvement has come primarily through the running game and defense.
Phil-Yes, I'm familiar with the theory. I think it was a guest article on FO from a while back.
Intuitively, it would make a lot of sense and I'd buy it. QBs with many college starts are less likely to be one-year-wonder flash-in-the-pan types like Cal's Kyle Boller.
However, the methodology from that article was severely flawed. It basically took a couple dozen QB variables and threw them all into a blender to see which ones turned up significant as predictors for NFL performance.
The problem with that methodology is that, by definition, 1 out of 20 correlations is going to appear significant when it's really just a type I error. So when you test a truck-load full of variables you'd expect to see a couple "false-positive" significant correlations. And there's no way to tell the true correlations from the false-positives.
Further, there's a good chance that one of the variables really is significant but isn't detected due to a type II error.
The methodology is valid as a first-look analysis, but you can't really draw any conclusions from it. I should probably do a post on this.
The PFR blog picks up the discussion of break-out rookie QB seasons.
?????
Isn't that the whole point of testing for statisically significance?
why does it make any difference whether you do it twenty at a time or one at a time?
The difference isn't in the stats but in the inference we can make about the stats. It's about the confidence we can have in the the conclusions we draw.
When you test a single variable and it turns out significant, there is a 1 in 20 chance there really isn't a connection between the independent and dependent variables. (Forgive me if you know all this and I sound patronizing.) This would be "type I error."
When I data-mine a basket of 20 different variables for a correlation, and 1 of them appears significant, I really haven't learned much because I'd expect about 1 type I error anyway. Say 2 variables turn up significant. Which of them is truly significant? The answer could be none, one, or both. We don't know.
With a basket of 20 variables, you actually have as high as 1-(1-0.05)^20) = 0.64 probability of at least 1 type I error. In other words, instead of the normal 95% confidence, there is only 36% confidence any apparently significant variable is in fact significant.
I don't have strong feelings either way about the theory connecting college starts with NFL performance, but the methodology used in that article doesn't really establish the connection. It's worth looking at closer, though.
(I can't find the article if anyone has a link.)
There's nothing wrong with testing a bunch of variables for a correlation, but it should be only a start. We'd need to do a lot more leg work before we draw conclusions. Bootstrapping subsets of the data might be where I'd begin.
what goes into 'bootstrapping subsets of the data'?
maybe the rest of your audience knows all this (I took a statistics class and econometrics class back in college), but I can't say I do (and for what its worth IMO you do a pretty good job of explaining alot of this stuff w/o being patronizing)
I think the article is in the Prospectus book that you have to buy (I don't know that there is an online version of it)
I've got the 2007 PFP, which has a follow-up article in it. That's where I got my understanding of the methodology in the research. The 2006 PFP has the original article.
Bootstrapping is dividing up the data into subsets, usually randomly, and then testing the relationships again. It's a way of gaining confidence in statistical inferences.
For example, in this study, you might divide up the data by draft years--'96, '97, etc.--and repeat the methodology for each year.
Say one of your variables was "QB's college conference" and you are testing if there is a connection between conference and pro performance. Naturally '98 will give the SEC a huge boost in significance because P. Manning went to Tenn. But any other year might prove to be insignificant for the SEC. We could conclude that the significant relationship observed between conference and pro performance is caused by a single individual. So the connection is really with the individual and conference is not that important.
What I'd do if I were FO is divide the data set in half. I'd use half the data to produce the regression equation they use as their forecast system. Then I'd test that forecast system against the 2nd half of the data. If it still predicts pro performance reasonably well, then I’d have confidence in the system.
If you just use the entire data set to produce the regression output, you’re likely to get an equation over-fit to non-repeating circumstances of the past, or to simple random luck. It might be retrodictively well-fit to past data (it forecasts the past), but not predictive at all. In the example, we’d know that just because Manning was from the SEC doesn’t mean future SEC QBs will be any better than those from the ACC or PAC 10.
The only reason I know this stuff is because I was guilty of perpetrating these errors myself!
yeah it seems to me that the sample size is the biggest draw back to the whole thing, I think there are only 20-30 QBs in the whole thing, so I would guess that it only takes a couple of guys to skew the data