
 You finally break away from Thanksgiving dinner and duck into the den where your dad and brother-in-law are watching the game. Your favorite team is playing the Cowboys, so as you enter the room, what's your first question? What's the score? 24-20 Cowboys they say. Darn. So what's your second question? How much time is left? 3 minutes in the 4th quarter. Uh oh. What's next on your mind? Who's got the ball? We do. Good. Where's the line of scrimmage? The 50. Ok. Down and distance?...
I think that's how most football fans intuitively assess the state of a game in their heads. And that's also pretty much how my in-game win-probability model works.
I've found that making a WP model is much harder than I first anticipated. There are over 43 conceivable score-differences, from -21 to +21. There are 3,600 seconds in a game, not even counting a potential overtime. Throw in 99 yard lines, 4 downs, and 20 or so 'to go' distances. That's over a billion possible game states, so obviously a model of any type would need a good deal of grouping and interpolation.
The first edition of my model considered only 2 variables: score difference and time remaining. Based on all 2,016 games of the past 8 regular seasons (2000 through 2007), I created a table of time remaining and score difference. Specifically, the table was the percentage of times a team with a first down went on to win at every combination of score difference and minutes remaining in the game. For example, a team with the ball and a first down (anywhere on the field) that's down by 3 points with 10 minutes remaining in the 3rd quarter wins about 42% of the time.
A graphical representation of the table, featuring the most common score differences is shown below. It's originally from my introductory article to win probability.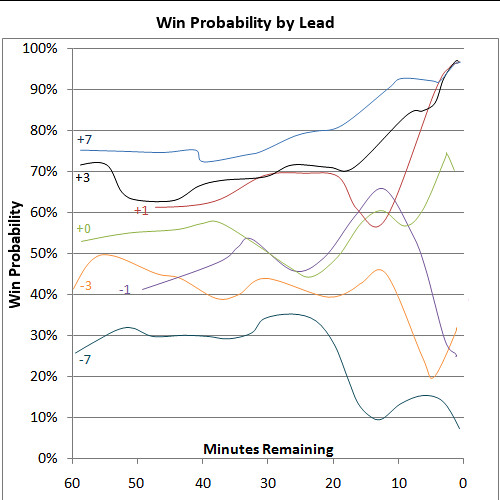
Looking at WP this way was straightforward but did not consider important factors such as field position, much less down and distance to go. There are a couple of obvious solutions. The most obvious is regression. Regression is like a hammer to statisticians, and to them every problem looks like a nail.
I chose a far simpler approach. With the luxury of a very large data set at my disposal--over 2,000 games and 119,000 1st downs--I could divide up the data into relatively specific categories without making the sample sizes too small. Instead of a single table of WP based on score difference and time remaining, I created five, each based on field position. The field was divided into five sections of 20 yards. So in our example above, a team down by 3 with 10 minutes to go in the 3rd quarter would have a 0.64 WP if inside an opponent's 20 yd line, but would have a 0.37 WP if between their own 20 and 40 yd lines.
Twenty yard chunks are pretty big, so my system extrapolates between the center-points of each 20-yard section of the field. For example, if a team had the ball on an opponent's 35 yd line, the system will look up the WP for the 20-40 yd line chunk and for the WP for the 40-40 yd line chunk. It will extrapolate proportionately between the two WPs. The end zone is, in effect, a sixth section of field position. This section basically adds 7 points and give the ball the other team at, on average, their own 27 yd line.
Unfortunately, each time the data is divided up, the sample sizes get smaller. There are some situations in which the historical sample size is relatively low. In those cases, I used a couple different techniques to estimate the WP.
First, I looked at the data graphically and attempted to minimize noise in low-sample cases by smoothing the data trends. Specifically I looked at the WP for a single point difference over each time remaining. I mostly used second-order moving averages to smooth the curves. For example, I looked at the winning percentage for a 3 point lead over every minute of the game. There were random variations from minute to minute due to sample error, but for the most part, the central trend was very clear.
There are some special low-sample cases where I could infer a valid WP. For example, a 2-point lead is relatively rare compared to a 1-pt lead at most points in a game. With less than 1 minute left, I know that both cases are effectively equivalent. A field goal by the trailing team wins the game in both cases.
Second, in many of the rarer score-difference cases, such as 5-point leads and 12-point leads, I used some extrapolation between large-sample cases. For example, there are very few actual cases of 12-point differences, but lots of 11- and 13-point leads. In these cases, I extrapolated between the high-sample cases. Usually the difference in WP between leads such as 11 and 13 points is small to begin with, so any error due to extrapolation won't be far off from reality.
My priority is to preserve the unique flow of the game depending on particular score differences. For instance, 4-point differences are categorically different that 3-point leads because a TD is required rather than a FG. And I realize that extrapolation sacrifices some of the unique character of certain leads, but I think it's a very reasonable solution. With a 2,016 game data set, there aren't many cases that require extrapolation. Plus, by definition those are the cases that rarely occur in games, so we don't expect to see them very often. Still, they need to be addressed somehow.
Over the past 8 full seasons, no team has ever come back from more than 21 points down at any point in a game. So I cut off the model at 21 points.
In football, every second counts, particularly at the end of each half. To consider seconds remaining, the system extrapolates between the mid-points of each minute, which are the 30-second marks.
Up to this point, the system is a series-level model. It considers score difference, time remaining, and field position. But down and distance still need to be factored in. To do so, the system starts knowing that for each 1st down and 10, a team has a 66% chance of converting. For subsequent downs, the system looks up the probability of converting. For example, if a team gains 8 yards on 1st down and now has a 2nd and 2 situation, they have an 85% chance of converting now. For 2nd and 3rd 4th downs, the system then adjusts the WP given the probability of a conversion or a kick.
For 4th downs, situations within field goal range (considered to be the 35 yard line or less) are assigned the weighted average WP of adding 3 points from the FG, or turning the ball over to the other team at the spot of the kick. For situations outside FG range, the WP is calculated for the opponent having position at the average punt distance down field given the current line of scrimmage. Punts vary in net distance based on the line of scrimmage. That is, they get shorter the closer to the end zone the punt occurs.
Currently, there are still some blind spots in the system. It does not consider time outs remaining, which can be crucial in the final seconds. Actually, it does "consider" them. It just assumes each team has the average number of time outs remaining throughout a game. It also doesn't account for who will receive the kick off following halftime. In reality, the team receiving the 3rd quarter kickoff would enjoy a slight advantage throughout the first half, particularly in very close games. Additionally, on 4th down, the model never expects a team to attempt the first down conversion. In other words, for now it assumes they will kick.
The model is a work in progress, and I expect to be able to solve each of these problems in time. There are some trade offs involved in running the model live, in real-time. Because the gamebook-style play-by-play descriptions are not updated online nearly as quickly as the simple game states, it makes it difficult to follow things like time outs and who received the first kick. I've chosen to sacrifice some fidelity for the ability to calculate WP live.
So after next Thanksgiving dinner, amaze your brother-in-law. Dial up advancednflstats.com on your Blackberry or iPhone. You can drop in little nuggets like, "We've got a 27% chance of getting a first down," or "Actually, Dallas has a 40% chance of winning if they score here," or "The Lions still have a 0% chance of winning."
Speaking of Thanksgiving, I know what I'll be thankful for this year--Bryant Gumble will not be broadcasting the night game.
PS I am truly enjoying this project. Developing a valid and useful model has been very challenging and equally rewarding. Doing the website development, however, has been even more fun. A few months ago, I knew nothing about web development or programming. I self-taught myself PHP, a programming language for web servers. (It's PHP that I used to collect all the play-by-play data I based the WP model on.) I then set up my own server system connected to a mySQL database. In the past month or so, I've taught myself Javascript and AJAX. And except for the two "...for Dummies" books I bought, this entire hobby hasn't cost a dime.
In-Game WP Model Explained
published on 11/08/2008


Subscribe to:
Post Comments (Atom)
Have you thought about releasing your parsing code or your database (perhaps it could be exported to a sqlite db). Having the play by play data available might help spur some more NFL research (or allow independent verification of other work).
Hi, Miles. Yes, that's a major goal of mine. I'd love to spread the wealth, and I really don't care for other sites with "proprietary" bunk. But there's a problem. Team and player stats are considered public domain, but putting a giant play-by-play database into the wild isn't so clear cut. The NFL vigilantly enforces its property rights to the games themselves.
So I can't give out the raw play-by-play data directly. It is however available on a game-by game basis at the NFL site itself, or at others such as Yahoo. It's just a pain to manually collate hundreds of games into something useful.
Here's my plan. I'm building a play-by-play parsing tool that can convert html play-by-play tables into a usable flat database file. That way I'm not giving anyone any data, just a tool to better interpret the data already freely offered by the NFL. I'll probably have something available this off-season.
My other idea is to create an online query tool that will predigest the data. So you wouldn't get raw play-by-play data, but you could find out the average gain on all 3rd downs by field position, or by time remaining, or whatever. It would be useful for research purposes while still not giving away "accounts of the game."
Cool! I wonder how Retrosheet got the data rights for Baseball. Have you had any discussions with http://footballproject.com?
I really appreciate all your efforts for this project as well. It has been pretty cool watching it develop this year. Also I just love all of the other analysis that you have done. I have been starting to work on some projects as well, nothing close to what you are doing. I know I would certainly be interested in even paying for some type of data tool like you are talking about. Here's one question that I have in regards to the play by play data that you might have. What percent of drives stall after a qb sack as compared to the average (I believe you said about 66% of 1st and 10 are 1st downs). It sure seems to me that drives with sacks are killer. Keep up the great work.
Buzz-that's a great research question. How does a single sack kill a drive? I'll be sure to do an article on that. If I forget to credit you, kindly poke me!
Have you noticed any differences of significance going back to 2000 between the HTML play-by-play and the PDF gamebooks on the NFL site?
How about using the play-by-play that is available via internet archive sites? I do believe 1999 and 1998 nfl gamebooks are complete as far as play-by-play goes. That could increase the database.
Also, has anyone found the HTML version of the gamebooks that have been available through the 2007 season on sportsline.com?
This is a great site; i love your analysis. i cant watch an NFL game without looking up the WP or efficiency rankings. I had a question about in game Win Probabilities.
I read this somewhere on your site but cant remember where i found it.
Somebody asked why you dont use the game probabilities that your efficiency model calculates at the begining of each game instead of 50/50; your response was something like "where do you merge the pre-game predictions, which may or may not be accurate, with the real game?" i completely agree.. with one second left the 12-0 team doesn't have a 95% chance of winning if they are down 14. I was wondering if you could take the two probabilites side by side (in game and eff. model) at the start of the game. multiply the efficiency model prediction by 1; add that quantity to the in game prediction (which is .50 right now) times 0. creat a linear relationship so that at the end of the game you multiply the in-game prediction by 1; add that to the efficiency model times 0. what im trying to say mathmatically is:
WP_displayed = Eff_prediction * ((game time - time elapsed)/game time) + In_game_prediction * (time elapsed / game time)
You dont actually have to do it; i just wondered if that made sense.
Thanks - Andy