
 Not everything I research gets posted here. 90% of it seems meaningless to me, so it's probably double meaningless to the rest of the world. But I thought I'd remove the filter, and just throw up some of the things I've used as building blocks in developing my win probability model. One of the important ingredients in any full model of football is kicking. So here are a couple of graphs you won't find interesting. No earth-shaking revelations about play calling, no bold counter-intuitive predictions, just data.
Punts average about 36 yards in the NFL. But where the punt takes place makes a big difference. Obviously, the closer to the end zone, the shorter a punt can be and the more likely a touchback is. The graph below plots the average net yards from punts at each position on the field. By field position, I mean line of scrimmage, not where the punter actually stood when he kicked.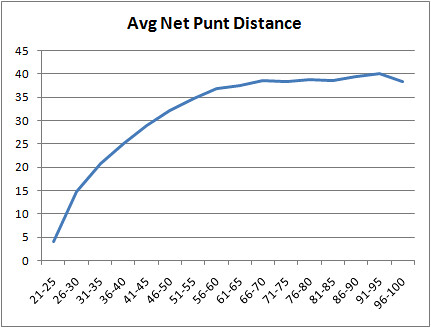
(I know what you're wondering. Who the hell kicked a punt from inside the 25 yard line? Nov 12th, 2000, the Bengals trailed the Cowboys by 14 points with 13 minutes remaining in the 4th quarter. On 4th and 14 from the Dallas 24, Cincinnati lined up for a field goal. The Bengals "faked" the field goal attempt and made a "quick kick" according to the entry in the gamebook. From what I can tell, this was the intentional play and not an aborted play. The result was a touchback. Net gain: 4 yds. Dallas went on to kick a field goal and won the game. Whatever. Heck, throw a pass! An interception at the 5 probably leaves you better off.)
The other graph I'll show is field goal percentage by field position. Again, I'm referring to the line of scrimmage, not the silly "field goal distance" you get by adding 10 yards for the end zone and 7 yards for the snap.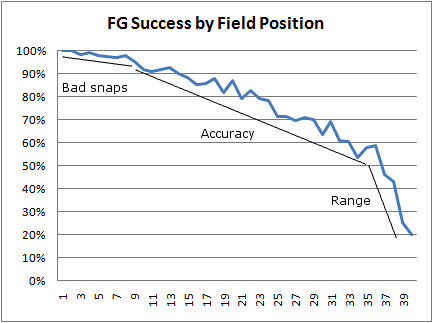
I'll make one observation about modeling field goal kicks. Out to the 10 yard line, it seems like bad snaps or holds would be the biggest factor in missed kicks. From the 10 out to the 36 yard line, accuracy is the determining factor. Then outside the 36, range is the limiting consideration. I'm sure different kickers have different ranges, and environmental factors are very important, but you can see a slight inflection at the 36.
Just for Kicks
published on 11/16/2008


Subscribe to:
Post Comments (Atom)
For me - the more data, the better. I love looking at stuff like this even if it doesn't have necessarily a ton of practical value.
Does your in-game model factor in HFA? I didn't think so, but it had Was as 54% to win right after Dallas tied it at 7-7 in the 2nd Q. Wasn;t sure if the 4% edge was due to HFA, or the fact that they were about to receive the ball.
The in-game model does not factor in HFA. It's purely general. The advantage was from the fact that WAS gets possession on average at its own 27.
I thought this post was interesting as well. Not earth shattering but it does help to get a better feel of what teams should do/expect in certain situations. Here is a random question. Since they have changed the rule for the coin flip how many teams now elect to kick off first in order to take the ball in the second half? I typically think this is a better strategy, especially at home in a big game that the fans are into. Do you have stats on records for teams receiving the opening kick also? I would wonder if there is any difference.
Cool. The punt graph starts curling downwards a little earlier than I would have expected. It's nice to see this stuff because I'll think through (or occasionally even discuss) this principle now and then - the closer you get to the opponent's goal line, the less you expect to gain from a punt - but it's nice to see the data to support it, and to put some numbers to it.
Hmm, what you call useless I could have used very much so about 8 months ago. A friend and I got into an arguement about whether Andy Lee of the 49ers deserved to go to the Pro Bowl. He claimed that because the 49ers were such an awful offense, Lee had more room to punt and thus made his Average look better. I said that this effect, which probably exists, probably didn't exist for field position in front of the 50 yard line, and so was mostly inconsequential.
And judging by the graph, from midfield on backwards is where it really starts to even out. But in either case, I could have used this graph to plot out and compare Lee's punt average to the "expected" average based on field position. And then did the same for Mat McBriar, who my friend claimed was more deserving because he was on the better offense.
You could argue that the most important 6 yards in football might be between the 39 yard line and the 33 yard line. Your probability of scoring increases 300% if you can just pick up those extra 6 yards when you reach the 39. (20% success from the 39 vs. 60% from the 33)
steve
I really got a KICK out of that Steve.